
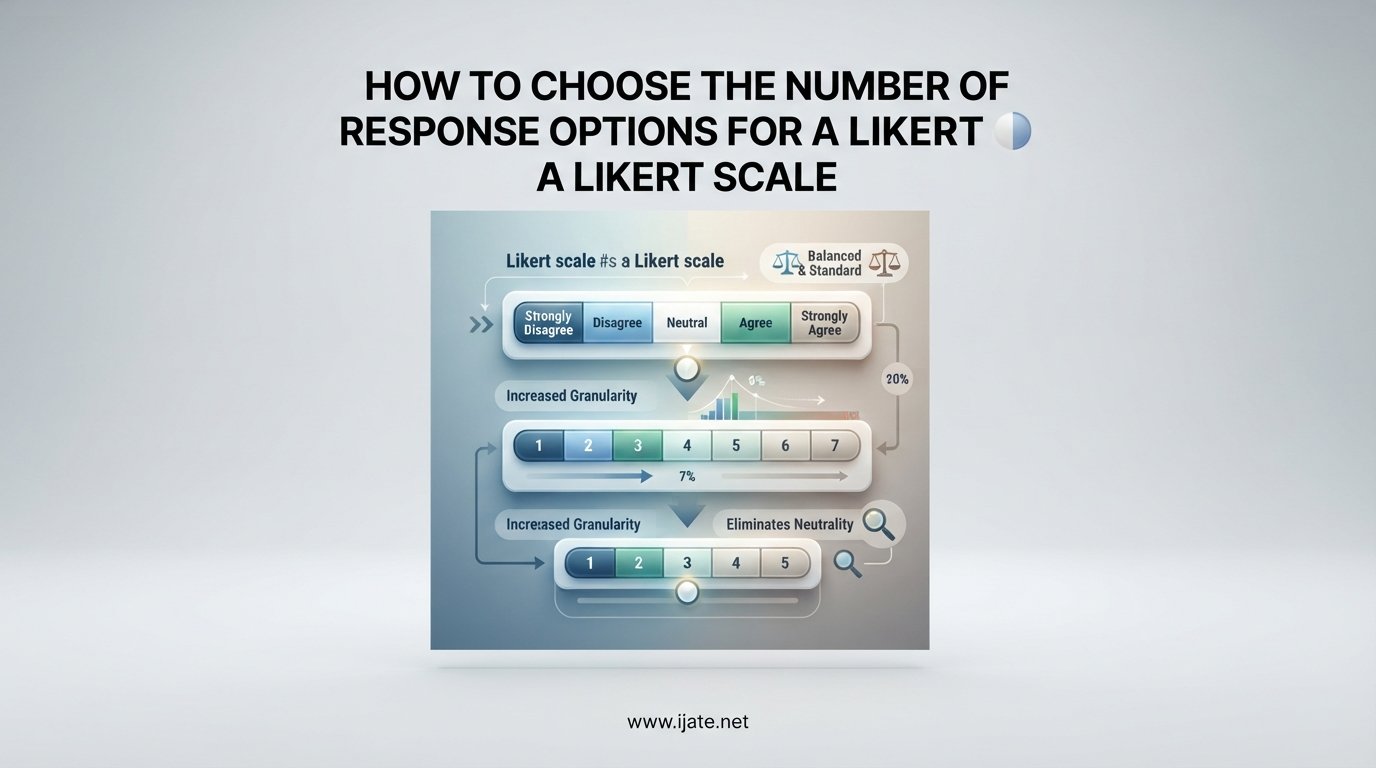
Most researchers should use 5 to 7 response options on a Likert scale, as decades of psychometric research consistently show this range provides the best balance between discrimination, reliability, and respondent ease. A 5-point scale works well for general surveys, while a 7-point scale offers slightly better variance and discrimination for research that demands more precision. Scales with fewer than 5 points sacrifice the ability to detect meaningful differences, and scales with more than 7 points introduce cognitive overload without improving data quality.
If you are designing a survey and wondering how to choose the number of response options for a Likert scale, you are not alone. This is one of the most frequently debated questions in survey methodology, and conflicting advice is everywhere. Some colleagues will push for a 10-point scale because it feels more precise. Others will insist on a 5-point scale because it is simple and familiar. The truth is that the right answer depends on several factors: your research goal, your audience, the type of construct you are measuring, and how you plan to analyze the data.
I have spent years designing and reviewing surveys across academic research, UX research, and program evaluation. In that time, I have seen how the wrong number of response options can undermine an otherwise well-designed study. Too few options flatten your data and hide real differences between respondents. Too many options confuse people, increase survey fatigue, and produce noisy data that is harder to interpret.
This guide breaks down everything you need to know about Likert scale response options. You will find a quick-decision table for fast reference, a detailed comparison of 3, 4, 5, 7, and 10-point scales, guidance on odd vs even points, bipolar vs unipolar design, labeling best practices, and a framework for making your final decision. Everything here is grounded in published psychometric research and real-world survey design experience.
Table of Contents
Quick Decision Guide: Choosing Scale Points by Use Case
If you need a recommendation fast, start here. The table below maps the most common survey use cases to the recommended number of response options and format. These recommendations draw from psychometric research and align with best practices used by experienced survey designers.
Table: Recommended Likert Scale Points by Use Case
Customer satisfaction (CSAT): 5-point bipolar scale (Very dissatisfied to Very satisfied)
Agreement / attitude measurement: 5-point bipolar scale (Strongly disagree to Strongly agree)
Employee engagement: 5-point or 7-point bipolar scale (Strongly disagree to Strongly agree)
Importance rating: 4-point or 5-point unipolar scale (Not at all important to Extremely important)
Frequency measurement: 5-point unipolar scale (Never to Always)
UX / usability rating: 7-point bipolar scale (Strongly disagree to Strongly agree)
Quality of life / health outcomes: 5-point or 7-point bipolar scale
Net Promoter Score (NPS): 11-point scale (0-10) – exception to the 5-7 rule, used for specific benchmarking
Forced-choice (no neutral option): 4-point or 6-point bipolar scale
Children or low-literacy populations: 3-point scale (with visual aids)
Use this table as a starting point, not a hard rule. Every survey context has unique demands that may shift the recommendation. The sections below explain the reasoning behind each recommendation so you can adapt the guidance to your specific situation.
Here is a simple three-step decision process to get you started. First, identify what you are measuring: agreement, satisfaction, importance, frequency, or quality. Second, decide whether your scale needs a neutral midpoint based on whether genuine neutrality is possible for your question. Third, choose the smallest number of points that gives you the discrimination you need for analysis. For most studies, that lands at 5 points.
What Is a Likert Scale?
A Likert scale is a type of survey rating format that measures attitudes, opinions, or behaviors across a range of ordered response options. Respondents select the option that best represents their level of agreement, satisfaction, frequency, or intensity relative to a statement. Each response option is assigned a numerical value, allowing researchers to quantify subjective data.
The format was developed by psychologist Rensis Likert in 1932. He introduced it as part of his work measuring attitudes toward social and political issues. The original Likert format used five points ranging from “Strongly approve” to “Strongly disapprove,” and it quickly became one of the most widely used response formats in social science research.
It is important to distinguish between a Likert item and a Likert scale. A single question with ordered response options is a Likert item. A Likert scale refers to the composite score created by summing or averaging responses across multiple Likert items that all measure the same underlying construct. For example, if you have five questions about job satisfaction, each using a 5-point response format, the combined score across all five items forms the Likert scale for job satisfaction.
This distinction matters for choosing response options because the number of points you select for each item affects the psychometric properties of the overall scale. More items measuring the same construct increase reliability. The number of response options on each item affects how well respondents can express the intensity of their feelings, which in turn affects data variance, discrimination between respondents, and the reliability of your composite scores.
Likert scale data is generally treated as ordinal, meaning the response categories have a logical order but the intervals between them are not necessarily equal. The distance between “Strongly disagree” and “Disagree” may not be the same as the distance between “Agree” and “Strongly agree” in a respondent’s mind. This has important implications for how you analyze the data, which we discuss later in this guide. For a deeper look at how these measurement properties work in practice, see this Likert-type scale development process from a real research study.
Despite the ordinal nature of individual items, many researchers treat summed or averaged Likert scale scores as approximating interval data, especially when using five or more points. This approximation allows the use of parametric statistical tests like t-tests and ANOVA. The debate over whether this is appropriate continues in the research community, but the practical consensus is that with sufficient points and sample size, parametric analysis of composite Likert scores is generally acceptable.
How to Choose the Number of Response Options for a Likert Scale
This is the core question, and it deserves a thorough answer. The number of response options on your Likert scale shapes the quality of your data in several ways: discrimination between respondents, variance in responses, reliability of the scale, cognitive load on respondents, and the types of statistical analysis you can perform. Let us walk through each option from 3 to 10 points.
The Research Basis: Why 5 to 7 Points Is Recommended
Multiple studies over the past several decades have converged on a consistent finding: 5 to 7 response options provide the optimal balance for most survey applications. Research by Lozano, Garcia-Cueto, and Muniz (2008) found that reliability increases as you move from 2 to 5 points, continues to improve slightly up to 7 points, and then plateaus or declines with more options. Joshi, Kale, and Chandel (2015) similarly found that 5-point and 7-point scales produce comparable reliability, with no significant improvement beyond 7 points.
The reasoning comes down to how the human mind processes categorical distinctions. Most people can reliably differentiate between about 7 levels of agreement or intensity. Beyond that, respondents start to struggle with distinguishing between adjacent options. If someone cannot tell the difference between a 7 and an 8 on a 10-point scale, those two points are functionally identical and add noise rather than information to your data.
With fewer than 5 points, the opposite problem occurs. Respondents who feel differently from each other are forced into the same category, reducing the ability to detect meaningful differences. A 3-point scale can only tell you whether someone leans negative, neutral, or positive, which is insufficient for most research purposes.
Understanding the psychometric properties behind these findings requires familiarity with concepts like item discrimination and variance. Researchers who want to go deeper into the measurement theory behind multi-point scales can explore item response theory for multi-category Likert scales, which explains how different numbers of response categories interact with measurement precision from a formal psychometric perspective.
3-Point Likert Scale
A 3-point scale offers three response options, typically “Disagree,” “Neutral,” and “Agree” or “Negative,” “Neutral,” and “Positive.” It is the simplest meaningful Likert format and has specific use cases where it outperforms longer scales.
Pros: Minimal cognitive load for respondents. Fast to complete. Works well for children, elderly respondents, or populations with low literacy. Easy to display on mobile devices without scrolling.
Cons: Very low discrimination. Cannot capture intensity of feeling. Reduces data variance, which limits statistical power. Forces respondents with meaningfully different attitudes into the same category.
When to use it: Use a 3-point scale when your respondents cannot reliably process more options. This includes young children, respondents with cognitive impairments, low-literacy populations, or surveys administered orally over the phone where visual scales are not available. It is also acceptable when you only need a broad directional read rather than nuanced measurement.
When to avoid it: Do not use a 3-point scale for research that requires detecting subtle differences between groups, correlating attitudes with outcomes, or conducting factor analysis. The restricted variance makes most advanced statistical analyses unreliable.
4-Point Likert Scale
A 4-point scale eliminates the neutral midpoint, forcing respondents to choose a directional response. A common configuration is “Strongly disagree,” “Disagree,” “Agree,” and “Strongly agree.”
Pros: Forces a directional choice, which can be valuable when you want to avoid the tendency of respondents to default to the middle option. Reduces central tendency bias. Useful when a neutral position is not meaningful for your question (for example, “This product is easy to use” – people either find it easy or they do not).
Cons: Some respondents genuinely feel neutral, and forcing them to pick a side introduces error. Can increase frustration and lead to item non-response. Does not allow respondents to express genuine ambivalence or lack of opinion.
When to use it: A 4-point scale is appropriate when you specifically want to eliminate fence-sitting behavior, when the construct being measured does not have a meaningful neutral point, or when you are conducting research where forced-choice methodology is standard practice. It is also useful in customer experience research where you want a clear directional signal.
When to avoid it: Avoid 4-point scales when genuine neutrality is common and meaningful. If you are measuring attitudes toward complex social issues where ambivalence is a real and common response, removing the neutral option distorts your data.
5-Point Likert Scale
The 5-point Likert scale is the most widely used response format in survey research. It typically ranges from “Strongly disagree” to “Strongly agree” with a neutral midpoint of “Neither agree nor disagree.” Rensis Likert’s original scale used five points, and decades of research have validated this as a strong default choice.
Pros: Familiar to most respondents. Provides adequate discrimination for most research purposes. Balances cognitive load with measurement precision. Works well across cultures and languages. Allows for meaningful neutral responses. Produces data that can be analyzed with a wide range of statistical techniques.
Cons: Some respondents overuse the neutral option. May not provide enough granularity for research requiring fine distinctions. Can be susceptible to acquiescence bias if all items are positively worded.
When to use it: Use a 5-point scale as your default for most survey research. It is appropriate for customer satisfaction surveys, employee engagement surveys, educational evaluations, attitudinal research, and program evaluations. If you are unsure how many points to use, start with 5.
When to avoid it: Consider alternatives when you need higher discrimination for research-grade measurement, when your stakeholders require benchmarking against scales that use different point counts, or when your specific population responds better to a different format.
7-Point Likert Scale
A 7-point scale adds two more levels of discrimination beyond the 5-point format. A common configuration is “Very strongly disagree,” “Strongly disagree,” “Disagree,” “Neutral,” “Agree,” “Strongly agree,” and “Very strongly agree.” Some researchers prefer labels like “Completely disagree” to “Completely agree” with intermediate gradations.
Pros: Slightly better reliability and discrimination than 5-point scales, according to research. Provides more variance, which improves statistical power for detecting group differences. Better suited for research involving factor analysis or structural equation modeling. Allows respondents to express nuanced attitudes.
Cons: Harder to write distinct labels for all seven points, which can lead to respondent confusion. Slightly higher cognitive load than 5-point scales. The marginal improvement in data quality over 5-point scales is modest, as MeasuringU research noted: “7-point scales are a little better than 5-points but not by much.”
When to use it: A 7-point scale is ideal for academic research, UX research, psychometric scale development, and any study where maximizing discrimination and reliability matters. It is also the preferred format when you plan to use advanced statistical techniques like factor analysis, structural equation modeling, or item response theory. For understanding how statistical difficulty interacts with scale design at this level, see this resource on statistical difficulty estimation for Likert items.
When to avoid it: Avoid 7-point scales for quick pulse surveys, mobile-first surveys where screen space is limited, or surveys targeting populations that may struggle with fine distinctions. Also reconsider if your team cannot create clear, distinct labels for all seven points.
10-Point Likert Scale
A 10-point scale uses numeric labels from 1 to 10, sometimes with text anchors only at the endpoints. This format is common in market research and customer experience measurement but is rarely recommended by psychometricians.
Pros: Feels precise to stakeholders who like the idea of a 1-10 score. Familiar from contexts like Net Promoter Score. Can produce visually appealing dashboard reports.
Cons: Research consistently shows no improvement in reliability or validity beyond 7 points. Respondents cannot meaningfully distinguish between adjacent options like 6 vs 7 or 3 vs 4 on an agreement scale. Numeric-only labels create ambiguity: does a 7 mean “good” or “mediocre”? Interpretation varies widely across respondents. Increases cognitive load without improving data quality.
When to use it: Use a 10-point or 11-point scale only when you are specifically replicating the Net Promoter Score methodology or when organizational benchmarking requires it. NPS uses an 11-point scale (0-10) because its scoring framework categorizes respondents into detractors, passives, and promoters based on specific cutpoints.
When to avoid it: Avoid 10-point scales for agreement-based Likert items. If stakeholders push for a 10-point scale because it “feels more precise,” share the research showing that the additional points add noise rather than signal. I have seen this scenario many times: a UX researcher on Reddit described how “higher-ups wanting to change our ranking scale from 1-5 to 1-10 simply because they feel [5-point] is insufficient.” The instinct is understandable, but the data does not support it.
Comparison Table: 3 vs 4 vs 5 vs 7 vs 10-Point Scales
The table below summarizes the key characteristics of each scale length to help you compare options side by side.
Table: Likert Scale Point Comparison
3-Point Scale – Discrimination: Low – Cognitive load: Very low – Neutral option: Yes (middle point) – Best for: Children, phone surveys, low-literacy populations – Reliability: Low to moderate
4-Point Scale – Discrimination: Low to moderate – Cognitive load: Low – Neutral option: No (forced choice) – Best for: Forced-choice surveys, directional measurement – Reliability: Moderate
5-Point Scale – Discrimination: Moderate – Cognitive load: Moderate – Neutral option: Yes (middle point) – Best for: General survey research, default choice – Reliability: Good
7-Point Scale – Discrimination: High – Cognitive load: Moderate to high – Neutral option: Yes (middle point) – Best for: Academic research, UX research, factor analysis – Reliability: Very good
10-Point Scale – Discrimination: High but noisy – Cognitive load: High – Neutral option: Depends on configuration – Best for: NPS benchmarking only – Reliability: No better than 7-point
Odd vs Even Scale Points: Should You Include a Neutral Midpoint?
The choice between odd and even numbers of response options is really a question about whether to include a neutral midpoint. Odd-numbered scales have a center point that represents genuine neutrality. Even-numbered scales eliminate this midpoint, forcing every respondent to choose a directional response. This is sometimes called a forced-choice format.
Both approaches have merit, and the right choice depends on your research question and the nature of the attitudes you are measuring.
Arguments for Including a Neutral Midpoint
The strongest argument for a neutral midpoint is honesty. Some respondents genuinely do not have an opinion, feel truly ambivalent, or see both sides of an issue equally. Forcing these respondents to pick a positive or negative response introduces measurement error. Their forced choice does not reflect their actual attitude, and your data becomes less accurate as a result.
A neutral option also reduces respondent frustration. When people feel they are being forced to express an opinion they do not hold, they may abandon the survey, select random responses, or default to a satisficing strategy where they pick the first acceptable option rather than thinking carefully.
Research on neutral option usage shows that typically 10-20% of respondents select the neutral midpoint on any given item. While some of these are genuine “fence-sitters” who could be pushed to choose a side, many represent authentic neutrality. Removing the option does not eliminate the underlying ambivalence; it just hides it.
Arguments Against a Neutral Midpoint
The case against the neutral midpoint rests on the observation that it becomes an easy default for respondents who do not want to think deeply about their response. Some respondents select “Neutral” or “Neither agree nor disagree” as a way to avoid cognitive effort, not because they genuinely feel neutral. This is called satisficing behavior.
When a neutral option is available, acquiescence respondents (those who tend to agree regardless of the question content) may use it as a hiding spot, which reduces the discrimination of your scale. Forced-choice scales eliminate this escape route and compel respondents to engage with the directional content of each item.
Forced-choice scales are particularly useful when your research requires a clear directional signal. In customer experience research, for example, you may want to know whether customers lean positive or negative without the ambiguity of a large neutral group. A 4-point or 6-point scale forces this clarity.
When to Use Odd vs Even Scales
Use an odd-numbered scale (with neutral midpoint) when genuine neutrality is a real and meaningful response. This applies to most attitude measurement, opinion surveys, and research where ambivalence or genuine lack of opinion is informative. If you are measuring attitudes toward a complex social issue, for instance, the percentage of people who feel neutral is itself a meaningful finding.
Use an even-numbered scale (forced-choice) when you need every respondent to commit to a direction, when neutral responses would undermine your analysis, or when you are measuring constructs where a neutral position is not conceptually meaningful. For example, “I found the login process confusing” does not have a meaningful neutral position: either you found it confusing or you did not.
A practical middle ground is to use a 5-point scale for most items but include a separate “Not applicable” or “Don’t know” option outside the numbered scale. This preserves the forced-choice quality of the four directional options while giving genuinely uncertain respondents an honest way to opt out without contaminating the directional data.
Bipolar vs Unipolar Scales: Matching Direction to Your Question
Scale polarity is one of the most important design decisions you will make, and it directly influences how many response options you should use. A bipolar scale runs from one extreme to its opposite, with a natural midpoint representing neutrality. A unipolar scale runs from an absence of something to a maximum amount of it, without an opposing pole.
Bipolar Scales Explained
A bipolar scale measures a construct that has two opposing directions. The classic example is an agreement scale: “Strongly disagree” at one end and “Strongly agree” at the other, with “Neither agree nor disagree” in the middle. The two poles represent opposite attitudes, and the midpoint represents genuine balance between them.
Bipolar scales work well with odd numbers of points because the midpoint has a natural meaning. Five points is the most common bipolar configuration: two negative options, a neutral center, and two positive options. Seven points adds more gradation on each side.
Common bipolar constructs include agreement (disagree to agree), satisfaction (dissatisfied to satisfied), and bipolar emotional states (sad to happy, anxious to calm). For all of these, the two poles are genuine opposites, and a midpoint represents a meaningful neutral state.
Unipolar Scales Explained
A unipolar scale measures a construct that exists along a single dimension from none to maximum. There is no opposing pole. The classic example is an importance scale: “Not at all important” at one end and “Extremely important” at the other. There is no such thing as “negative importance,” so the scale only moves in one direction.
Unipolar scales work well with both odd and even numbers of points. Because there is no natural opposing pole, the concept of a “neutral midpoint” is less meaningful. A 4-point unipolar scale does not feel like forced choice in the same way a 4-point bipolar scale does, because the absence of a middle option on a unipolar scale does not prevent genuine neutrality in the same way.
Common unipolar constructs include importance (not important to very important), frequency (never to always), intensity (not at all to extremely), and quality (poor to excellent). All of these measure the presence or amount of something rather than a direction.
How Polarity Affects Optimal Scale Points
The number of response options you choose should align with your scale polarity. For bipolar scales, odd numbers of points (5 or 7) are generally preferred because the midpoint represents a genuine neutral position between two opposites. For unipolar scales, either odd or even configurations can work well, and the choice depends more on whether you want to allow a midpoint response.
One common mistake is using a bipolar label structure for what is actually a unipolar construct. For example, labeling a satisfaction scale from “Very dissatisfied” to “Very satisfied” is bipolar and should have an odd number of points. But labeling it from “Not satisfied” to “Very satisfied” is unipolar and does not have a natural neutral point. Make sure your labels and point count are consistent with your polarity choice.
Here is a simple decision rule. If your construct has two genuine opposites (agree-disagree, satisfied-dissatisfied, positive-negative), use a bipolar scale with 5 or 7 points. If your construct measures amount or presence of something without an opposite (not important to extremely important, never to always), use a unipolar scale with 4, 5, or 7 points depending on your discrimination needs.
Labeling and Anchoring Your Response Options
The number of response options you choose is only half the battle. How you label those options has an equally important effect on data quality. Clear, distinct labels help respondents understand what each point means and make consistent choices across items. Poor labels create confusion and introduce measurement error regardless of how many points you use.
Research consistently supports labeling every response option rather than only the endpoints. When only endpoints are labeled (for example, showing “Strongly disagree” at one end and “Strongly agree” at the other with only numbers in between), respondents interpret the unlabeled points differently. One person’s 3 on a 5-point scale may mean something quite different from another person’s 3. Full labeling reduces this interpretive variance and improves data quality.
Each label should be semantically distinct from its neighbors. On a 5-point agreement scale, the labels “Strongly disagree,” “Disagree,” “Neither agree nor disagree,” “Agree,” and “Strongly agree” are clearly differentiated. On a 7-point scale, finding seven distinct labels becomes harder. You might use “Very strongly disagree,” “Strongly disagree,” “Disagree,” “Slightly disagree” – but at this level, respondents may struggle to distinguish “Disagree” from “Slightly disagree.”
Maintain consistent direction throughout your survey. If the first item uses “Strongly disagree” on the left and “Strongly agree” on the right, every subsequent agreement item should follow the same direction. Switching direction mid-survey (called polarity flipping) confuses respondents and produces invalid responses. Some researchers intentionally reverse-code certain items to prevent acquiescence bias, but this should be done carefully and the direction of the response options themselves should not change.
Numeric labels can supplement text labels but should not replace them. Showing numbers (1-5 or 1-7) alongside text labels can help respondents understand the scale structure, but numbers alone create ambiguity. On a 1-10 numeric scale, a respondent might interpret a 7 as “good” while another interprets it as “mediocre.” Text labels anchor the meaning and reduce this ambiguity.
Response Bias and How Scale Point Count Affects It
Response bias is a systematic tendency for respondents to answer in ways that do not reflect their true attitudes. The number of response options on your Likert scale interacts with several common types of response bias, and understanding these interactions helps you choose a point count that minimizes distortion.
Acquiescence Bias
Acquiescence bias is the tendency for respondents to agree with statements regardless of their content. People who exhibit this pattern will select “Agree” or “Strongly agree” even to items they would disagree with if they thought more carefully. This bias is particularly problematic when all items in a scale are worded in the same direction.
More response options do not directly reduce acquiescence bias, but they do interact with it. On a 5-point scale, an acquiescent respondent tends to choose 4 (Agree). On a 7-point scale, the equivalent might be 5 or 6. The key mitigation strategy is to include reverse-worded items that require disagreement to indicate a positive response. For example, alongside “I am satisfied with my job,” include “I often think about leaving my job.” This forces respondents to engage with the content rather than defaulting to agreement.
Extreme Response Style
Some respondents consistently select the most extreme options, either the highest or lowest point on every scale. Others avoid extremes and cluster toward the middle. The number of response options you provide interacts with this tendency. More points give extreme respondents more room to differentiate their highest selection, but they also give moderate respondents more middle-ground options to select.
Research shows that extreme response style varies across cultures. Respondents from some cultural backgrounds are more likely to use extreme endpoints, while others favor middle-of-the-road responses. This means that the same scale administered cross-culturally may produce different distributions not because of genuine attitude differences but because of cultural response styles. When designing cross-cultural surveys, a 5-point scale is generally recommended because it provides adequate differentiation while being less susceptible to cultural extreme response patterns than longer scales. For a deeper look at how scale items function differently across respondent groups, see this research on differential item functioning analysis in scale validation.
Straight-Lining
Straight-lining is when respondents select the same response option for every item in a matrix or battery of questions, often without reading each item. This is a form of satisficing that introduces significant error into your data. Longer scales can help reduce straight-lining because they require more cognitive engagement to process each option.
However, the relationship is not linear. Moving from 3 to 5 points noticeably reduces straight-lining because respondents have more options to differentiate. Moving from 5 to 7 points has a smaller effect. Beyond 7 points, any reduction in straight-lining is offset by increased cognitive fatigue. Matrix questions (where multiple items share the same response scale) are particularly susceptible to straight-lining, and breaking matrices into individual questions can help regardless of point count.
Primacy and Recency Effects
Primacy effect is the tendency for respondents to select options presented first. Recency effect is the tendency to select options presented last. Both effects can distort response distributions, and they interact with scale length. Longer scales give respondents more options to scan, which can amplify primacy effects as respondents latch onto early options to reduce cognitive effort.
To minimize primacy and recency effects, randomize the order of response options across respondents where conceptually appropriate. This is not always possible because ordered scales have a logical sequence, but in some cases you can randomize whether positive or negative options appear first. Research published in Performance Improvement Journal found that the order of Likert-type response options (ascending vs descending) affects psychometric properties, particularly for scales with many points.
Examples by Use Case: Scale Recommendations in Practice
Abstract guidelines are helpful, but concrete examples make the recommendations easier to apply. Below are five common survey scenarios with specific scale configurations that work well in each context.
Example 1: Customer Satisfaction Survey
Question: “How satisfied are you with your recent purchase experience?”
Recommended scale: 5-point bipolar
Options: Very dissatisfied – Somewhat dissatisfied – Neither satisfied nor dissatisfied – Somewhat satisfied – Very satisfied
Why: Customer satisfaction is a bipolar construct with two genuine opposites. Five points provide enough discrimination to identify trends without overwhelming respondents. The neutral midpoint captures genuinely indifferent customers, which is itself informative. This configuration is also compatible with standard CSAT reporting frameworks.
Example 2: Employee Engagement Survey
Question: “I feel valued for my contributions at this organization.”
Recommended scale: 5-point bipolar agreement
Options: Strongly disagree – Disagree – Neither agree nor disagree – Agree – Strongly agree
Why: Agreement is the most natural response format for evaluative statements about workplace experiences. Five points align with standard employee engagement benchmarking frameworks and allow for comparison across organizations. If your organization uses a 7-point scale for benchmarking purposes, that is also acceptable here.
Example 3: Importance Rating in Prioritization Research
Question: “How important is each of the following features to you?”
Recommended scale: 4-point unipolar
Options: Not at all important – Slightly important – Important – Very important
Why: Importance is a unipolar construct; there is no such thing as “negative importance.” A 4-point scale without a midpoint forces respondents to make meaningful distinctions between features, which is the goal of prioritization research. If you need more granularity, a 5-point unipolar scale with “Moderately important” added is also effective.
Example 4: Frequency Measurement in Behavioral Research
Question: “How often do you use public transportation?”
Recommended scale: 5-point unipolar
Options: Never – Rarely – Sometimes – Often – Always
Why: Frequency is a unipolar construct measured from “never” (absence) to “always” (maximum). Five points provide clear, distinct categories that respondents can easily understand. Each label is semantically distinct, reducing interpretation variance.
Example 5: UX Research with System Usability Scale
Question: “I thought the system was easy to use.”
Recommended scale: 7-point bipolar agreement (or 5-point if using the standard SUS format)
Options (7-point): Very strongly disagree – Strongly disagree – Disagree – Neutral – Agree – Strongly agree – Very strongly agree
Why: UX research benefits from higher discrimination because usability differences can be subtle. Seven points provide the granularity needed for detecting small but meaningful differences in user perception. Note that the original System Usability Scale uses a 5-point format, so if you are using SUS scoring methodology, stick with 5 points for compatibility.
Common Mistakes When Choosing Likert Scale Points
Even experienced survey designers make mistakes when selecting the number of response options. Here are five of the most common errors and how to fix them.
Mistake 1: Defaulting to a 10-Point Scale Because It Feels Precise
The problem: Stakeholders or team members push for a 10-point scale because more points feels like more precision. The reality is that respondents cannot meaningfully distinguish between 7 and 8 on a 1-10 agreement scale, and the additional points add noise to your data without improving reliability.
The fix: Share the research. Multiple studies show no improvement beyond 7 points, and often deterioration in data quality. Propose a 7-point scale if stakeholders want high granularity, or a 5-point scale as the default. Reserve 10 or 11-point scales for NPS methodology only.
Mistake 2: Switching Scale Direction Mid-Survey
The problem: One question uses “Strongly disagree” on the left and “Strongly agree” on the right, while the next reverses the order. This confuses respondents and produces invalid responses as people select options based on position rather than content.
The fix: Standardize your scale direction throughout the entire survey. If you need to reverse-code items for psychometric purposes (to prevent acquiescence bias), keep the visual scale direction consistent and handle the reversal during data analysis by recoding the numerical values.
Mistake 3: Mixing Bipolar and Unipolar Scales Without Thinking
The problem: Using a bipolar label structure (dissatisfied to satisfied) for a construct that is actually unipolar, or vice versa. This creates confusion about what the midpoint means and produces data that is difficult to interpret.
The fix: Before writing labels, determine whether your construct has genuine opposites. If yes, use a bipolar scale with odd points. If no, use a unipolar scale and choose points based on your discrimination needs.
Mistake 4: Not Pilot Testing the Scale
The problem: Launching a survey without testing how real respondents interact with the response options. Labels that seem clear to the designer may confuse respondents, and point counts that seem adequate may produce ceiling or floor effects.
The fix: Always conduct a pilot test with a small sample of your target population. Look for response distributions that cluster too heavily at one end, high rates of neutral selection, or patterns suggesting respondents cannot distinguish between adjacent options. Adjust your scale based on pilot data before full deployment.
Mistake 5: Ignoring Mobile Display Constraints
The problem: A 7-point or 10-point scale that displays cleanly on a desktop may wrap awkwardly or require horizontal scrolling on a mobile device. This degrades the respondent experience and can bias responses toward options that are visible without scrolling.
The fix: Test your survey on mobile devices before launch. If you are using a matrix question format, consider breaking it into individual questions for mobile respondents. For mobile-first surveys, a 5-point scale is often the safest choice because it displays cleanly across all screen sizes.
FAQs
How many options should there be on a Likert scale?
A Likert scale should typically have 5 to 7 response options. Research consistently shows that this range provides the best balance between discrimination, reliability, and respondent ease. A 5-point scale is the most common default for general surveys, while a 7-point scale offers slightly better discrimination for research requiring higher precision. Scales with fewer than 5 points reduce the ability to detect meaningful differences, and scales with more than 7 points add cognitive load without improving data quality.
How many response options are best for most rating scales?
For most rating scales, 5 response options provide the best combination of measurement quality and respondent usability. Five-point scales are familiar to most respondents, provide adequate discrimination for the majority of research applications, and work well across different delivery formats including mobile surveys. A 7-point scale is slightly better for research-grade measurement but the improvement over 5 points is modest.
How many response categories are sufficient for Likert-type scales?
Five response categories are generally sufficient for Likert-type scales. This number allows respondents to express meaningful gradations of agreement or intensity while keeping cognitive load manageable. Seven categories provide slightly better discrimination and are sufficient for more demanding research applications. Fewer than 5 categories is rarely sufficient for anything beyond broad directional measurement, and more than 7 categories does not improve reliability.
What types of response choices are available on Likert scales?
Likert scales offer several types of response choices including bipolar agreement scales (Strongly disagree to Strongly agree), bipolar satisfaction scales (Very dissatisfied to Very satisfied), unipolar importance scales (Not at all important to Extremely important), unipolar frequency scales (Never to Always), and unipolar quality scales (Poor to Excellent). Scales can use odd numbers of points with a neutral midpoint or even numbers for forced-choice designs. Numeric-only scales (1-10) are also used but are less recommended than fully labeled text scales.
Is a 5-point or 7-point Likert scale better?
Both 5-point and 7-point Likert scales are excellent choices. A 7-point scale provides slightly better discrimination and reliability, making it preferable for academic research, factor analysis, and studies where detecting small differences matters. A 5-point scale is simpler for respondents, displays better on mobile devices, and is more familiar to the general public. For most applied survey research including customer satisfaction and employee engagement, a 5-point scale is sufficient. Choose 7 points when measurement precision is the priority.
Can I use parametric tests on Likert scale data?
There is ongoing debate about this, but the practical consensus is that parametric tests like t-tests and ANOVA can be used on Likert scale data when you have 5 or more response points, multiple items measuring the same construct, and a reasonable sample size. Individual Likert items are ordinal, but composite scores created by summing or averaging multiple items approximate interval data well enough for parametric analysis. For individual items with small samples, non-parametric tests like Mann-Whitney U or Kruskal-Wallis are more appropriate.
Should I include a neutral midpoint in my Likert scale?
Include a neutral midpoint when genuine neutrality is a real and meaningful response for your question. Odd-numbered scales (5 or 7 points) with a midpoint are appropriate for most attitude and opinion measurement. Use an even-numbered forced-choice scale (4 or 6 points) only when you need every respondent to commit to a direction or when a neutral position is not conceptually meaningful for the construct you are measuring.
Conclusion: Making Your Final Decision
Choosing the right number of response options for a Likert scale comes down to three key decisions. First, identify the type of construct you are measuring and whether it is bipolar or unipolar. Second, decide whether a neutral midpoint is meaningful for your question. Third, select the smallest number of points that gives you the discrimination your analysis requires.
For most surveys, that process leads to a 5-point bipolar scale. When you need more precision, move to 7 points. When you need forced directional responses, drop to 4 points. And when you are working with special populations or contexts, adjust accordingly. The research is clear: 5 to 7 points is the sweet spot, and knowing how to choose the number of response options for a Likert scale is a foundational skill that will improve the quality of every survey you design.
Whatever scale you choose, pilot test it with real respondents before full deployment. No amount of theoretical knowledge replaces the insight you gain from watching actual people interact with your survey. Pilot testing reveals ceiling effects, label confusion, and response patterns that no guide can predict. Build, test, refine, and launch with confidence.