
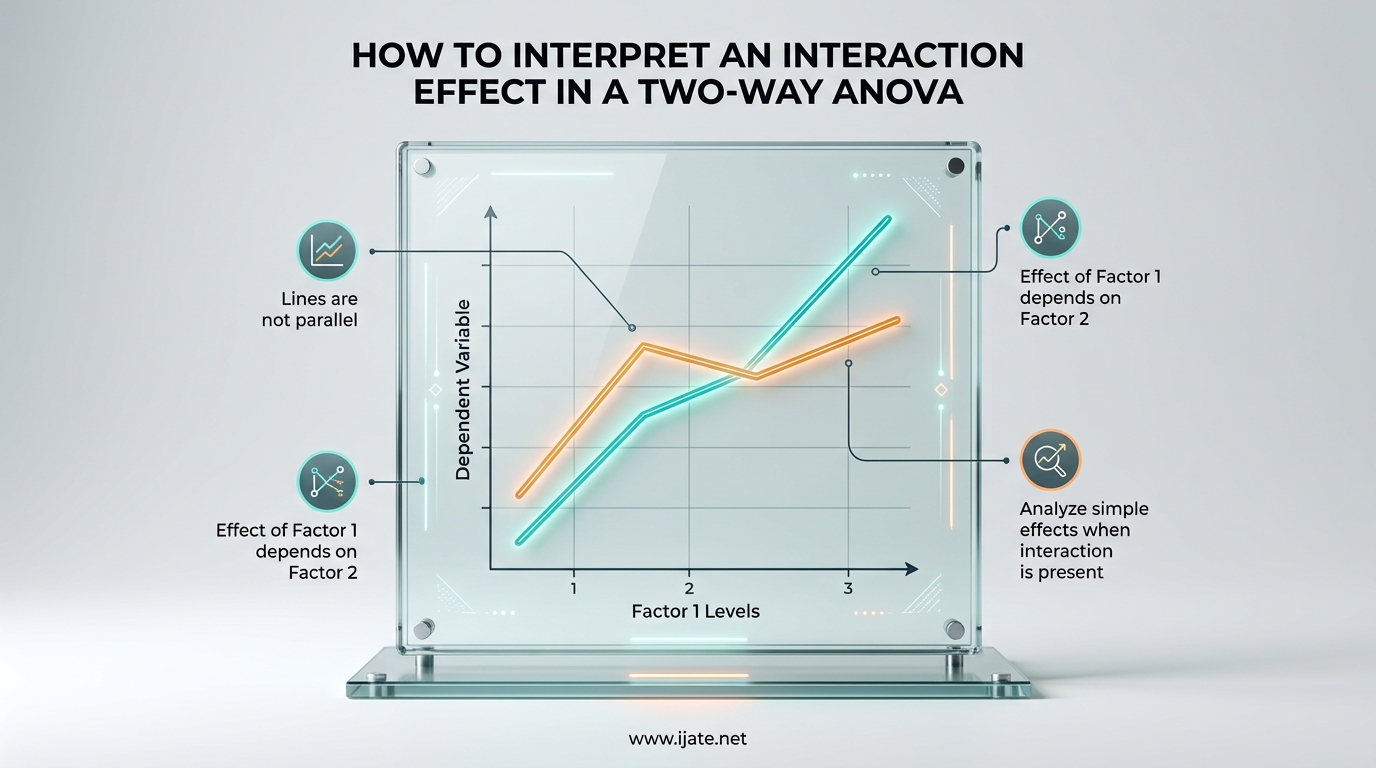
You ran a two-way ANOVA, the interaction term came back significant, and now you are staring at the output wondering what it actually means. I have been there, and so have thousands of researchers who post on statistics forums every month asking the same question. Learning how to interpret an interaction effect in a two-way ANOVA is one of the most valuable skills you can develop as a researcher, because it changes how you understand your data.
An interaction effect tells you that the story is more nuanced than “Treatment A works better than Treatment B.” It reveals that the treatment might work differently depending on which subgroup you examine. Without understanding interactions, you risk reporting averages that hide what is really happening in your experiment.
In this guide, I will walk you through what an interaction effect is, how it differs from a main effect, how to read an interaction plot, and exactly what to do after your software flags a significant interaction. I will use real examples with actual numbers so you can apply this directly to your own research in 2026.
Table of Contents
What Is an Interaction Effect in a Two-Way ANOVA
An interaction effect in a two-way ANOVA occurs when the effect of one independent variable on the dependent variable depends on the level of another independent variable. In simpler terms, one factor changes the way the other factor behaves.
Think of it like a recipe. Adding salt might improve the taste of soup, but adding the same amount of salt to ice cream would ruin it. The effect of salt depends on the dish. That dependency is the interaction.
In a factorial design with two categorical variables, you test three things simultaneously: the main effect of Factor A, the main effect of Factor B, and the interaction between A and B. The interaction term answers a specific question: does the difference between levels of Factor A stay the same across all levels of Factor B? If the answer is no, you have an interaction.
This matters because real-world effects are rarely simple. A drug dosage that works well for one gender might be ineffective or even harmful for another. A teaching method that boosts test scores in one age group might flop with a different one. The interaction effect captures these conditional relationships that main effects alone miss entirely.
Main Effects vs Interaction Effects
A main effect is the overall, average effect of one independent variable, ignoring the other factor. If you average across all levels of Factor B and ask whether Factor A still moves the needle, that is the main effect of A.
An interaction effect is different. It asks whether the effect of Factor A is consistent across levels of Factor B, or whether it changes. When the interaction is significant, the main effects can become actively misleading.
Here is why that happens. Suppose Treatment A increases scores by 10 points for males but decreases scores by 10 points for females. If your sample has equal numbers of males and females, the main effect of treatment appears to be zero. The treatment looks useless when you average across genders. But the treatment is not useless at all. It has a large effect that goes in opposite directions for different groups, and only the interaction reveals that.
This is the single most important distinction in two-way ANOVA interpretation. When the interaction is significant, your first responsibility is to understand the interaction, not report the main effects in isolation.
Statistics textbooks sometimes call this the principle of marginality. The main effects are marginal averages, and when an interaction exists, those marginal averages can hide the true pattern hidden inside the cell means. The cell means, which are the means for each combination of factor levels, tell the real story.
How to Read an Interaction Plot
An interaction plot is a line graph that makes interaction effects visible. The x-axis shows levels of one factor, the y-axis shows the mean of the response variable, and separate lines represent levels of the second factor. Learning to read this plot is the fastest way to understand your interaction.
Here is the key rule: parallel lines mean no interaction, and non-parallel lines suggest a possible interaction.
Parallel Lines: No Interaction
When the lines in your interaction plot run parallel to each other, the effect of one factor is consistent across all levels of the other factor. The gap between the lines stays roughly the same at every point on the x-axis. This means the factors operate independently, and you can interpret the main effects without worrying about an interaction.
Diverging Lines: Ordinal Interaction
When lines fan out or converge but do not cross, you have what statisticians call an ordinal interaction. The effect of one factor changes in magnitude depending on the level of the other factor, but the direction does not flip. Treatment A is still better than Treatment B at every level, but the size of the advantage grows or shrinks. These interactions are real but often more subtle in their practical implications.
Crossing Lines: Disordinal Interaction
When lines cross, you have a disordinal interaction, which is often the most dramatic and important type. The effect of one factor reverses direction depending on the level of the other factor. Treatment A might be better for males while Treatment B is better for females. Crossing lines are a strong visual signal that the interaction is driving your results and that reporting main effects alone would be deeply misleading.
U-Pattern Lines
Sometimes the lines form a U-shape or an inverted U. This pattern often appears when one factor has opposite effects at the extremes of the other factor. These interactions require careful interpretation because the visual pattern can be striking but may reflect a complex underlying relationship between your categorical variables.
How to Interpret an Interaction Effect: Step-by-Step
Here is the step-by-step process I recommend for interpreting a significant interaction effect in a two-way ANOVA. Follow these six steps and you will avoid the most common reporting mistakes.
Step 1: Check the p-value for the interaction term
Look at the ANOVA table output from your software. Find the row labeled with both factor names, such as “Diet:Gender” or “Treatment:Time.” Read the p-value in that row. If the p-value is below your alpha level, typically 0.05, the interaction is statistically significant and you should proceed with interaction-focused interpretation.
Step 2: Examine the interaction plot
Create an interaction plot with one factor on the x-axis and separate lines for the levels of the other factor. Look at the pattern of the lines. Are they parallel, diverging, or crossing? The visual pattern tells you what kind of interaction you are dealing with before you run any further tests.
Step 3: Calculate and compare simple main effects
Simple main effects break down the interaction by examining the effect of one factor at each level of the other factor separately. For example, if you have a Treatment by Gender interaction, you would test the effect of Treatment within males and the effect of Treatment within females. This tells you exactly where the differences lie.
Step 4: Run post-hoc pairwise comparisons
Once you know which simple main effects are significant, run pairwise comparisons within those specific groups. Apply a correction for multiple comparisons, such as Bonferroni or Tukey, to control the familywise error rate. This step prevents false positives from running many tests.
Step 5: Report effect sizes
Statistical significance only tells you whether an effect is likely real, not whether it is large enough to matter. Report partial eta squared or another effect size measure for the interaction. This helps readers judge whether the interaction is practically meaningful, not just statistically detectable.
Step 6: Write up the interpretation
Your write-up should lead with the interaction, describe the pattern of cell means, report the simple main effects, and explain what the pattern means in plain language. Avoid leading with main effects when the interaction is significant, because that framing can confuse readers about what the data actually shows.
Three Interpretation Scenarios for Interaction Effects
Every two-way ANOVA result falls into one of three scenarios. Understanding each one before you run your analysis prepares you to interpret whatever output you get.
Scenario 1: Significant Interaction, No Significant Main Effects
This is the scenario that confuses people the most. You have a significant interaction but neither main effect reaches significance. The temptation is to conclude that nothing is happening, but that conclusion would be wrong.
What is actually happening is that the effects exist but point in opposite directions for different groups, canceling each other out in the marginal means. Treatment A helps one subgroup and hurts another, so the average effect across all participants looks like zero. The interaction is telling you something important is happening, and you must interpret the simple main effects to find out what.
Real example: a teaching method raises test scores for visual learners but lowers them for auditory learners. The main effect of teaching method appears null. Only the interaction and the subsequent simple main effects reveal that the method matters enormously, just in opposite directions for different learners.
Scenario 2: Significant Interaction and Significant Main Effects
When both the interaction and one or both main effects are significant, you might think you can report everything. But the same principle applies: the interaction takes priority.
The main effects are still technically present in the data, but they are not the whole story. A significant main effect might be driven entirely by one subgroup while the other subgroup shows no effect at all. Reporting the main effect without the interaction context would misrepresent the pattern.
In this scenario, report the main effects for completeness, but focus your interpretation on the interaction and the simple main effects. The interaction explains why the main effects look the way they do.
Scenario 3: No Significant Interaction, Significant Main Effects
This is the easiest scenario. When the interaction term is not significant, you can interpret the main effects independently. The factors operate additively, and the effect of one factor does not depend on the level of the other.
In this case, report the main effects, run your post-hoc comparisons on the main effects, and you are done. No simple main effects analysis is needed because there is no interaction to decompose.
One caution: a non-significant interaction does not prove there is no interaction. It only means you did not detect one. With small sample sizes, you may lack the power to detect a real interaction. Always consider the effect size and confidence interval of the interaction term, not just the p-value.
Practical Example: Drug Dosage and Gender Interaction
Let me walk through a full example so you can see how all the pieces fit together. Suppose we test three drug dosages (Low, Medium, High) on pain scores in both male and female patients. This is a 3 by 2 factorial design.
The Cell Means
The table below shows the mean pain score for each combination of dosage and gender. Lower scores mean less pain, which is the desired outcome.
| Dosage | Male Mean | Female Mean | Marginal Mean |
|---|---|---|---|
| Low | 7.0 | 7.5 | 7.25 |
| Medium | 5.0 | 6.0 | 5.5 |
| High | 3.0 | 6.5 | 4.75 |
| Marginal Mean | 5.0 | 6.67 |
Reading the Marginal Means
Looking at the marginal means, you might conclude that the High dosage is best overall (4.75 average pain) and that males report less pain than females overall. But those marginal means hide a critical pattern.
The Interaction Pattern
For males, increasing the dosage steadily reduces pain from 7.0 down to 3.0. The drug works well, and more is better. For females, the pattern is completely different. Pain drops slightly at Medium dosage (from 7.5 to 6.0) but then goes back up at High dosage (6.5). The High dosage helps males dramatically but does not help females much at all.
If you plotted these means on an interaction plot, the line for males would slope steadily downward while the line for females would dip and rise again. The lines are clearly non-parallel, and the interaction term in your ANOVA table would almost certainly be significant.
The Interpretation
The interaction tells you that you cannot make a blanket recommendation about dosage. The optimal dosage depends on gender. For males, High dosage is clearly the best choice. For females, Medium dosage is preferable, and pushing to High dosage offers no additional benefit and may even be slightly worse.
Reporting only the main effects would have led to a misleading recommendation. The main effect of dosage suggests High is best on average, but that advice would harm female patients. This is exactly why interaction effects matter so much in applied research.
Simple Main Effects Analysis After a Significant Interaction
Once you confirm a significant interaction, the next step is simple main effects analysis. This is where you decompose the interaction into its component parts.
Simple main effects test the effect of one factor at each individual level of the other factor. In our drug example, you would test the effect of dosage separately for males and separately for females. Each test tells you whether dosage matters within that specific subgroup.
To run simple main effects, you subset your data by one factor and run a one-way ANOVA on the other factor within each subset. Apply a Bonferroni correction by dividing your alpha level by the number of simple main effects tests you run. If you test dosage within males and dosage within females, that is two tests, so you would use an alpha of 0.025 for each.
After identifying which simple main effects are significant, run pairwise comparisons within those groups to pinpoint exactly which levels differ. This layered approach, from interaction to simple main effects to pairwise comparisons, gives you a complete picture of what the data is telling you.
Common Mistakes When Interpreting Interactions
I see the same mistakes repeated across forums, student papers, and even published research. Here are the four most common errors and how to avoid them.
Mistake 1: Reporting Main Effects When the Interaction Is Significant
This is the number one error. When the interaction is significant, leading with the main effects can mislead readers. The main effect of a factor might be significant in your ANOVA table, but it may be driven entirely by one subgroup. Always lead with the interaction when it is significant.
Mistake 2: Confusing Statistical Significance With Practical Importance
A p-value below 0.05 with a huge sample size can flag a tiny, meaningless interaction. Always check the effect size. Partial eta squared values below 0.01 indicate a negligible interaction even if it is statistically significant. Report both the p-value and the effect size so readers can judge the practical importance.
Mistake 3: Running the Wrong Post-Hoc Tests
When the interaction is significant, standard post-hoc tests like Tukey HSD applied across all groups can produce confusing or contradictory results. The correct approach is simple main effects analysis followed by pairwise comparisons within the relevant subgroups. This targeted approach respects the structure of the interaction.
Mistake 4: Ignoring Assumptions
Two-way ANOVA assumes normality of residuals, homogeneity of variance, and independence of observations. A significant interaction means nothing if those assumptions are badly violated. Always check your diagnostic plots before celebrating a significant result.
R Code Example for Two-Way ANOVA With Interaction
Here is a quick R example that runs a two-way ANOVA with an interaction term and produces an interaction plot. This uses the built-in aov() and interaction.plot() functions.
# Run two-way ANOVA with interaction

model <- aov(pain_score ~ dosage * gender, data = mydata)

summary(model)
# Create interaction plot

with(mydata, interaction.plot(dosage, gender, pain_score,

        type = "b", col = c("blue","red"), pch = c(16,18),

        main = "Interaction: Dosage by Gender",

        xlab = "Drug Dosage", ylab = "Mean Pain Score"))
The summary output shows the p-value for each term, including the interaction labeled as “dosage:gender.” The interaction plot visually confirms whether the lines are parallel or not. Together, these two outputs give you everything you need to begin interpreting the interaction.
Decision Checklist for Interaction Effects
Use this checklist whenever you run a two-way ANOVA to make sure you interpret the interaction correctly.
1. Is the interaction p-value below your alpha level?
2. If yes, do not lead your report with main effects.
3. Generate an interaction plot and identify the line pattern.
4. Calculate simple main effects for each subgroup.
5. Run corrected pairwise comparisons within significant simple main effects.
6. Report partial eta squared for the interaction effect size.
7. Write up the interpretation in plain language that a non-statistician can follow.
8. If the interaction is not significant, interpret main effects with confidence.
FAQs
What does an interaction effect in a two-way ANOVA indicate?
An interaction effect in a two-way ANOVA indicates that the effect of one independent variable on the dependent variable changes depending on the level of the other independent variable. In other words, the two factors do not act independently. The impact of Factor A differs across levels of Factor B, meaning you cannot interpret either factor’s effect without considering the other.
How do you interpret an interaction effect?
To interpret an interaction effect, follow these steps: First, confirm the interaction p-value is significant in your ANOVA table. Second, examine the interaction plot to see if lines are parallel (no interaction) or non-parallel (interaction present). Third, run simple main effects analysis to test each factor within each level of the other factor. Fourth, conduct corrected pairwise comparisons within significant subgroups. Finally, report the effect size and write up the pattern in plain language, focusing on the interaction rather than main effects.
What is the interaction effect in ANOVA?
The interaction effect in ANOVA is a term in the model that captures whether the combined effect of two factors differs from the sum of their individual effects. It tests whether the effect of one factor is consistent across all levels of the other factor. A significant interaction means the factors work together in a way that neither main effect alone can describe.
How do you interpret the results of a two-way ANOVA?
Start by checking the interaction term. If the interaction is significant, prioritize it over the main effects, because main effects can be misleading when an interaction exists. Examine the interaction plot, run simple main effects to decompose the interaction, and conduct pairwise comparisons within subgroups using an appropriate correction. If the interaction is not significant, interpret each main effect independently and run standard post-hoc comparisons on the marginal means. Always report effect sizes alongside p-values to convey both statistical and practical significance.
Conclusion
Interpreting an interaction effect in a two-way ANOVA comes down to one core principle: when the interaction is significant, the effect of one factor depends on the level of the other, and that dependency is the story your data is telling you. Main effects alone cannot capture that story, and reporting them in isolation can actively mislead your readers.
The process is straightforward once you internalize it. Check the interaction p-value, plot the cell means, identify the line pattern, decompose with simple main effects, run corrected pairwise comparisons, and report the effect size. Follow the decision checklist every time, and you will interpret interactions correctly whether you are working on a class project, a thesis, or a published study in 2026.
The most important shift in thinking is this: a significant interaction is not a complication to explain away. It is often the most interesting and useful finding in your entire study. It tells you where your treatment works, where it does not, and for whom. That conditional knowledge is exactly what good research is supposed to uncover.