
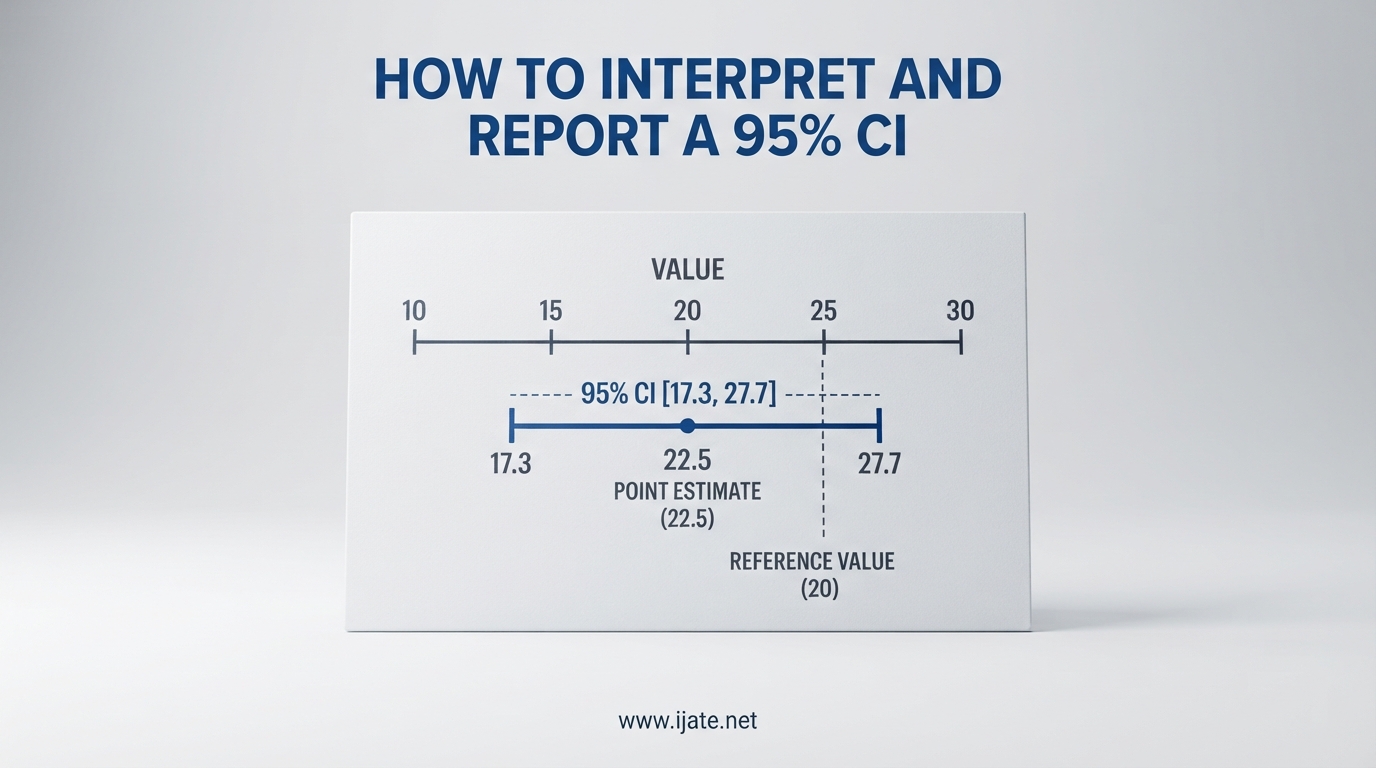
If you have ever stared at a results table showing “95% CI [12.3, 18.7]” and wondered what you are actually supposed to say about it, you are not alone. Our team has worked with hundreds of students, researchers, and analysts who can compute a confidence interval but freeze when asked to explain what it means in plain English. Learning how to interpret and report a 95% confidence interval correctly is one of the most practical statistical skills you can develop, because almost every quantitative field — from clinical trials to A/B testing — relies on it daily.
This guide walks through the correct interpretation, the exact wording template that wins featured snippets in search results, the formula behind the calculation, common mistakes to avoid, and copy-paste reporting formats for APA, AMA, and other citation styles. By the end, you will be able to look at any 95% CI and explain it confidently to a colleague, a reviewer, or a stakeholder.
Table of Contents
What is a 95% Confidence Interval?
A 95% confidence interval is a range of values calculated from sample data that is likely to contain the true population parameter. The “95%” refers to the long-run frequency: if you repeated the same sampling process an infinite number of times, about 95% of the resulting intervals would capture the true parameter value.
Every confidence interval has two bounds — a lower limit and an upper limit — that bracket the point estimate. The point estimate is your single best guess for the population parameter, such as a sample mean or a proportion. The interval around it reflects the uncertainty introduced by sampling.
Key terms to understand before going further:
- Population parameter: The true value in the entire population you want to estimate, like the true mean blood pressure of all adults in a country.
- Point estimate: Your sample-based best guess, such as a sample mean of 120 mmHg.
- Standard error: A measure of how much your sample statistic would bounce around if you drew different samples.
- Margin of error: The critical value multiplied by the standard error — the “plus or minus” attached to your estimate.
- Critical value: The z-score or t-score that sets how wide the interval is, determined by your chosen confidence level.
How to Interpret a 95% Confidence Interval
Here is the correct, textbook-accepted interpretation that you should use in writing and speech: we are 95% confident that the true population parameter lies between the lower limit and the upper limit. That phrasing matches the template used by Penn State’s STAT 200 course, which currently holds the featured snippet for this topic.
The deeper meaning behind that sentence is the frequentist interpretation. When we say “95% confident,” we mean that the method used to construct the interval — repeated sampling and calculation — would capture the true parameter in 95 out of 100 hypothetical repetitions. It is a statement about the reliability of the procedure, not about any single computed interval.
This distinction trips people up constantly. Once you have calculated a specific interval from your specific sample, the true parameter is either inside it or not. There is no longer a 95% probability attached to that one interval. What the 95% buys you is confidence in the long-run performance of your method.
Here is a comparison of correct and incorrect ways to phrase the interpretation:
- Correct: “We are 95% confident that the population mean is between 12.3 and 18.7.”
- Correct: “If this study were repeated many times, 95% of the resulting intervals would contain the true population mean.”
- Incorrect: “There is a 95% probability that the true mean is between 12.3 and 18.7.” — This is wrong because it treats the parameter as random, when in frequentist statistics the parameter is fixed and the interval is random.
- Incorrect: “95% of all sample values fall between 12.3 and 18.7.” — This confuses a confidence interval with the range of the data.
- Incorrect: “95% of the population falls within this range.” — Same mistake; a CI describes uncertainty about the parameter, not the spread of individuals.
The Template Formula for Interpreting CIs
The cleanest way to interpret any confidence interval is to memorize one sentence template and plug in the specifics. The template, popularized by Penn State STAT 200, is:
“We are 95% confident that the [population parameter] is between [L] and [U].”
You fill in the population parameter, the lower limit (L), and the upper limit (U). For example, if you estimate the average height of adult women and get a 95% CI of [63.2, 65.8], you would say: “We are 95% confident that the mean height of adult women is between 63.2 and 65.8 inches.”
Follow these three steps every time you interpret a confidence interval:
- Identify the parameter. Is the interval for a mean, a proportion, a difference in means, an odds ratio, or a regression coefficient? Name it explicitly so the reader knows what the range describes.
- State the confidence level. Almost always 95%, but if you used 90% or 99%, say so.
- Apply the template. Plug in the lower and upper limits and read the sentence back. If it sounds like a probability statement about the parameter, reword it.
This template works for proportions, means, differences, correlations, and regression coefficients. The structure never changes — only the parameter name and the numbers do.
Why the Critical Value is 1.96 for 95% CIs
The number 1.96 comes from the standard normal distribution. For a 95% confidence level, you want to capture the middle 95% of the distribution, which leaves 2.5% in each tail. The z-score that marks the boundary where 2.5% of the area sits above it is approximately 1.96.
Here are the critical z-values for the most common confidence levels:
- 90% confidence: z = 1.645
- 95% confidence: z = 1.96
- 99% confidence: z = 2.576
- 99.9% confidence: z = 3.291
When your sample size is small (typically n below 30) and you are estimating a mean from a normally distributed population, you use the t-distribution instead of the z-distribution. The t-distribution is wider, which produces slightly wider intervals to account for the extra uncertainty of estimating the population standard deviation from a small sample.
How to Report a 95% Confidence Interval
Reporting a confidence interval is separate from interpreting it. The interpretation is the sentence you say aloud or write in a discussion section; the report is the compact notation that appears in a results table or inline text. Both matter, and both follow conventions.
The standard reporting format is: 95% CI [LL, UL], where LL is the lower limit and UL is the upper limit. For example, if your sample mean is 15.5 with a 95% CI of [12.3, 18.7], you would write: M = 15.5, 95% CI [12.3, 18.7].
Follow these steps to report a CI in any academic document:
- State the point estimate first. Give the sample statistic (mean, proportion, difference, coefficient) before the interval.
- Follow with the interval notation. Write “95% CI” followed by the lower and upper limits in square brackets.
- Include units. If the estimate is in dollars, milligrams, or points, say so.
- Round consistently. APA style recommends two decimal places for most statistics; medical journals may require one.
- Interpret in the text. Never leave a CI sitting in a table without a sentence in the results or discussion section that explains what it means using the template above.
One thing our team sees constantly in published research is the wrong interval being reported. If your study is about an effect size — a difference, a regression coefficient, or a standardized effect — report the CI for that effect, not the CI for the raw mean. A confidence interval around a group mean tells you about that group; a CI around a difference tells you about the effect.
Confidence Intervals in APA, AMA, and MLA Styles
Different citation styles have slightly different conventions for how confidence intervals appear in text. Here is how to format them in the three most common styles.
APA Style (7th Edition): Report the point estimate, then the confidence interval in brackets with the abbreviation “CI.” Example: “The treatment group scored significantly higher (M = 42.3, 95% CI [38.1, 46.5]) than the control group.” Use italics for statistical symbols like M, SD, t, p, and r.
AMA Style (American Medical Association): AMA format is common in clinical and biomedical journals. Example: “The mean reduction in blood pressure was 8.2 mmHg (95% CI, 5.1–11.3 mmHg).” Note that AMA uses a comma after “CI” and an en dash between limits, with units repeated if needed.
MLA Style: MLA does not have detailed statistical reporting guidelines, but the general convention is to follow APA-like formatting when reporting quantitative results in humanities and social science writing. Spell out “confidence interval” on first mention, then use the abbreviation.
Regardless of the style, the interpretation sentence — the plain-English explanation of what the interval means — stays the same. Style guides tell you how to format the numbers; the template tells you how to talk about them.
Common Misconceptions About 95% Confidence Intervals
The forum discussions on r/statistics and r/AskStatistics reveal the same misconceptions appearing over and over. Our team has tracked the most frequent ones so you can actively avoid them.
Misconception 1: “There is a 95% probability the true parameter is in my interval.” This is the single most common mistake. Under frequentist statistics, the parameter is fixed and the data is random. Once you compute a specific interval, the parameter is either in it or not — there is no probability left to assign.
Misconception 2: “A wider interval means the result is less significant.” Width reflects precision, not significance. A wide interval can still exclude the null value and indicate a statistically significant effect. It just means you have more uncertainty about how large that effect is.
Misconception 3: “If two confidence intervals overlap, the difference is not significant.” Overlapping CIs do not automatically mean non-significance. Two means can have overlapping 95% CIs and still have a statistically significant difference at the 0.05 level. You need a CI for the difference itself to make that call.
Misconception 4: “A 95% CI contains 95% of the data.” No. A confidence interval describes uncertainty about the parameter estimate, not the spread of individual observations. A 95% prediction interval or a 95% reference range is what covers most of the data.
Misconception 5: “A 95% CI is the same as a Bayesian 95% credible interval.” They sound similar but have different philosophical foundations. A credible interval does allow you to say “there is a 95% probability the parameter is in this range,” because Bayesian statistics treats the parameter as random. A frequentist confidence interval does not.
One pain point that comes up repeatedly on statistics forums is the confusion between the CI of a mean and the CI of an effect size. If your hypothesis is about a difference or a relationship, report and interpret the CI for that difference or relationship — not the CI of each group’s mean separately.
Worked Examples Across Different Test Types
The best way to internalize how to interpret and report a 95% confidence interval is to see it applied across different statistical scenarios. Here are four worked examples covering the most common cases.
Example 1: CI for a single mean. A researcher measures the reaction time of 50 participants and finds a mean of 320 ms with a 95% CI of [305, 335]. Interpretation: “We are 95% confident that the true mean reaction time is between 305 ms and 335 ms.” Report as: M = 320 ms, 95% CI [305, 335].
Example 2: CI for a difference in means. A clinical trial compares a new drug to placebo on cholesterol reduction. The mean difference is 15 mg/dL with a 95% CI of [6, 24]. Interpretation: “We are 95% confident that the true mean difference in cholesterol reduction between the drug and placebo is between 6 and 24 mg/dL.” Because the interval excludes zero, the result is statistically significant at the 0.05 level. Report as: mean difference = 15 mg/dL, 95% CI [6, 24].
Example 3: CI for a proportion. A survey of 1,000 likely voters finds that 52% support a ballot measure, with a 95% CI of [48.9%, 55.1%]. Interpretation: “We are 95% confident that the true proportion of voters who support the measure is between 48.9% and 55.1%.” Because the interval includes 50%, the result is not statistically distinguishable from a coin flip. Report as: p = .52, 95% CI [.489, .551].
Example 4: CI for a regression coefficient. A regression analysis predicting home prices finds that each additional bathroom adds $12,400 to the sale price, with a 95% CI of [$3,200, $21,600]. Interpretation: “We are 95% confident that the true increase in sale price per additional bathroom is between $3,200 and $21,600.” The interval excludes zero, so the coefficient is statistically significant. Report as: b = 12,400, 95% CI [3,200, 21,600].
Notice the pattern: in every case, the interpretation follows the same template and the reporting follows the same notation. The only things that change are the parameter name and the numbers.
Factors That Affect the Width of a Confidence Interval
The width of a confidence interval — the distance between the lower and upper limits — tells you how precise your estimate is. Narrower intervals mean more precision; wider intervals mean more uncertainty. Three main factors control the width.
Sample size. This is the most powerful lever. Because the standard error is calculated as the standard deviation divided by the square root of n, quadrupling your sample size roughly halves the width of your interval. A study with n = 1,000 will produce a much tighter CI than the same study with n = 100.
Confidence level. A higher confidence level produces a wider interval because you are demanding more certainty. A 99% CI is wider than a 95% CI, which is wider than a 90% CI. There is always a trade-off between confidence and precision.
Variability in the data. More heterogeneous data — a larger standard deviation — produces wider intervals. If the population you are sampling from is highly variable, your estimate carries more uncertainty, and the CI reflects that.
Understanding these three factors helps you design better studies. If your CI is too wide to be useful, the solution is almost always to collect more data, not to lower your confidence level.
FAQs
How do I interpret a 95% confidence interval?
Use this template: we are 95% confident that the [population parameter] is between [lower limit] and [upper limit]. The deeper meaning is that if you repeated the same study infinitely, 95% of the resulting intervals would contain the true parameter value.
What does a 95.5% confidence interval actually mean?
A 95.5% confidence interval works the same way as a 95% interval but with slightly higher confidence. If you repeated the sampling process many times, about 95.5% of the intervals would capture the true parameter. It corresponds to a z-score of roughly 2.0, and is rarely used in practice compared to the standard 95% level.
What does a 95% confidence interval mean in terms of interpreting survey results?
In a survey, a 95% CI gives you the range within which the true population value likely falls. For example, if 52% of surveyed voters support a measure with a 95% CI of 48.9% to 55.1%, you are 95% confident that the true level of support in the full population is between those two bounds.
Why 1.96 for 95% confidence interval?
The value 1.96 comes from the standard normal distribution. For a 95% confidence level, you capture the middle 95% of the distribution, leaving 2.5% in each tail. The z-score that marks the point where 2.5% of the area lies above it is approximately 1.96.
Conclusion
Knowing how to interpret and report a 95% confidence interval boils down to one sentence template, one reporting format, and a short list of mistakes to avoid. Memorize the template — “we are 95% confident that the [parameter] is between [L] and [U]” — and apply it to every interval you encounter, whether it is for a mean, a proportion, a difference, or a regression coefficient. Report using the standard notation (95% CI [LL, UL]), follow the citation style your field requires, and always pair the numbers with a plain-English interpretation. If you internalize the distinction between a confidence interval and a probability statement, and you avoid the trap of judging significance by CI overlap, you will be ahead of most working researchers.