
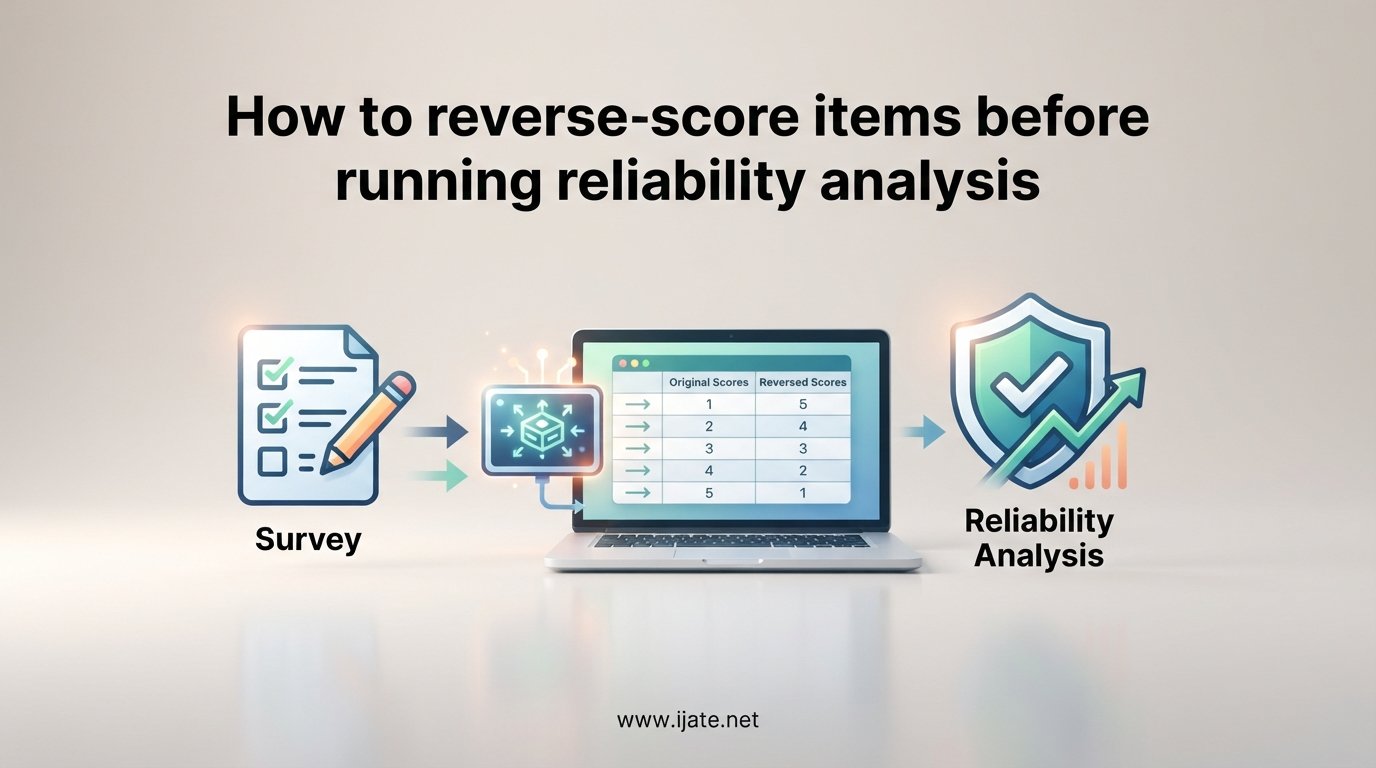
Yes, you must reverse-score items before running reliability analysis. If your questionnaire contains negatively worded items, skipping reverse coding will deflate or even negate your Cronbach’s alpha, producing misleading results that can undermine your entire study.
Reverse scoring is the process of mathematically flipping the values of negatively worded items so that a high response means the same thing across every item in your scale. Without this step, an item that measures the opposite construct from the rest will correlate negatively with the other items, dragging down your internal consistency estimate. Researchers working through a full validity and reliability study routinely encounter this requirement when their instrument includes mixed-direction items.
In this guide, our team walks through why reverse scoring matters, the exact formula to use, step-by-step instructions for SPSS plus alternative software (Excel, R, Python, and Jamovi), and how to verify your work before interpreting Cronbach’s alpha output. We also cover common mistakes that researchers report on forums, so you can avoid the pitfalls that lead to negative alpha values and corrupted data.
Table of Contents
Quick Answer: The Reverse Scoring Formula
To reverse score any item, use this formula:
reverse_score(x) = (maximum value + 1) – x
For a 1-to-7 Likert scale, the maximum value is 7, so the formula becomes: new_score = 8 – old_score. A response of 1 becomes 7, a 7 becomes 1, a 2 becomes 6, and a 4 stays 4.
Here is the full transformation for a 1-7 scale:
1 becomes 7
2 becomes 6
3 becomes 5
4 stays 4 (the midpoint is always unchanged)
5 becomes 3
6 becomes 2
7 becomes 1
You must complete this transformation for every negatively worded item before computing Cronbach’s alpha, item-total correlations, or factor scores. No exceptions.
Why Reverse Scoring Is Necessary Before Reliability Analysis
Most psychometric scales are designed so that higher total scores indicate more of the construct being measured. But scale developers often include negatively worded items as an attention check or to reduce response bias. These reverse-worded items mean the opposite: a high score on a negative item indicates less of the construct.
This creates a directionality problem. If Item 1 says “I enjoy my work” and Item 2 says “I dread going to work,” both measured on a 1-7 agreement scale, a person who loves their job might score 7 on Item 1 and 1 on Item 2. Without reverse scoring, these two items correlate negatively with each other. That negative correlation tells the reliability formula that the items disagree, when in reality they measure the same construct from opposite directions.
Cronbach’s alpha is based on the average inter-item correlation. When some items correlate negatively because they were not reverse-scored, the average correlation drops. In extreme cases, the alpha can approach zero or even turn negative. A negative Cronbach’s alpha is almost always a sign that you forgot to reverse-score one or more items.
Here is what happens in practice. Say you have a 5-item scale where Item 3 is negatively worded. If you run reliability analysis without reverse coding Item 3, its item-total correlation will be negative (perhaps -0.45). The overall alpha might come out around 0.35 instead of the true 0.82. Once you apply the reverse-scoring formula to Item 3 and rerun the analysis, that same item’s correlation flips to +0.45 and alpha jumps to its correct value.
This is why every methodological source agrees: reverse-score first, then run reliability analysis. The same logic applies to factor analysis. Reverse coding does not change the eigenvalues or the percentage of variance explained, but it does flip the sign of the factor loadings for the reversed items so they load in the expected direction.
The Reverse Scoring Formula Explained
The reverse scoring formula works for any scale, whether it is 1-5, 1-7, 0-4, or something else entirely. The general version is:
reverse_score(x) = (scale_maximum + scale_minimum) – x
For 1-based scales (where the minimum is 1), this simplifies to the version most textbooks cite:
reverse_score(x) = (max + 1) – x
The formula works because it reflects every score around the midpoint of the scale. The midpoint never changes, which is why a score of 4 on a 1-7 scale stays 4 after reverse scoring. Scores above the midpoint swap with their mirror image below the midpoint.
Worked Example: 1-to-5 Likert Scale
For a 1-to-5 scale, the formula is: new_score = 6 – old_score.
1 becomes 5
2 becomes 4
3 stays 3
4 becomes 2
5 becomes 1
Worked Example: 1-to-7 Likert Scale
For a 1-to-7 scale, the formula is: new_score = 8 – old_score. This is the scale used in the Benevolent Sexism Scale tutorial from Hanover College, which is one of the most referenced examples in research methods courses.
Worked Example: 0-to-4 Scale
Some scales use 0-based scoring, where 0 means “not at all” and 4 means “extremely.” The formula adjusts because the minimum is now 0, not 1:
new_score = (0 + 4) – old_score = 4 – old_score
0 becomes 4
1 becomes 3
2 stays 2
3 becomes 1
4 becomes 0
Reddit users on r/AskStatistics and r/spss frequently report confusion with 0-based scales because the common “max + 1” shortcut does not work. Always use the general formula (min + max – x) when your scale does not start at 1, and verify a few transformed values manually before processing your entire dataset.
How to Reverse-Score Items Before Running Reliability Analysis in SPSS
SPSS is the most commonly used software for reliability analysis, and it offers two main approaches to reverse scoring. Our team recommends the Compute Variable method because it creates a new variable rather than overwriting your original data. Here is the step-by-step process.
Step 1: Identify Which Items Need Reverse Scoring
Check your instrument’s codebook or scoring manual. The manual will specify which items are negatively worded and need reverse coding. If you do not have a manual, read each item carefully and identify any item where agreement indicates the opposite of your target construct.
Step 2: Create New Variables (Never Overwrite Originals)
Before transforming anything, decide on a naming convention for your reverse-scored variables. A common approach is to add an “R” suffix: if the original item is named Q3, the reverse-scored version becomes Q3R. This preserves your original data and makes it easy to audit your work.
Step 3: Use Transform, Then Compute Variable
Click Transform in the top menu.
Select Compute Variable.
In the Target Variable box, type the name of your new variable (e.g., Q3R).
In the Numeric Expression box, type the formula: 8 – Q3 (for a 1-7 scale). Replace 8 with max + 1 for your specific scale.
Click OK to create the new variable.
SPSS will populate the new column with the reverse-scored values while leaving the original Q3 column untouched.
Step 4: Repeat for Each Negatively Worded Item
Go through each item that needs reverse scoring and repeat the Compute Variable process. If you have multiple items to reverse, you can do them one at a time or use SPSS syntax to batch the process.
SPSS Syntax for Batch Reverse Scoring
If you prefer syntax (which is faster and more reproducible), paste this into a syntax window and run it:
COMPUTE Q3R = 8 – Q3.
COMPUTE Q7R = 8 – Q7.
COMPUTE Q12R = 8 – Q12.
EXECUTE.
Change the “8” to match your scale (use 6 for a 1-5 scale, 4 for a 0-4 scale). The EXECUTE command at the end tells SPSS to process all the COMPUTE statements at once.
Step 5: Verify the Transformation
Run Analyze, then Descriptive Statistics, then Descriptives on both the original and reverse-scored variables. The mean of the original and the mean of the reverse-scored version should add up to the scale midpoint times the number of cases. The minimum and maximum should be swapped: if the original ranges from 1 to 7, the reverse-scored version should also range from 1 to 7 but in the opposite direction.
Alternative Methods: Reverse Scoring in Excel, R, Python, and Jamovi
Not everyone uses SPSS. Our research found that no major competitor covers reverse scoring in software beyond SPSS and SAS, so here are instructions for the tools survey researchers increasingly rely on.
Reverse Scoring in Excel
If your data is in Excel, use a simple formula in a new column. For a 1-7 scale where the original item is in column B (starting at B2), enter this formula in an adjacent column:
=8 – B2
Copy the formula down the entire column. For a 1-5 scale, use =6 – B2. For a 0-4 scale, use =4 – B2. Always label the new column clearly (e.g., “Q3_Reverse”) so you do not confuse it with the original.
Reverse Scoring in R
In R, you can reverse score using base arithmetic. If your data frame is called “survey” and the item is in column Q3, run:
survey$Q3R <- 8 – survey$Q3
For batch processing across multiple columns, use the psych package, which has a built-in reverse key function:
library(psych)
survey_scored <- reverse.key(survey, keys = c(“Q3”, “Q7”, “Q12”), mini = 1, maxi = 7)
The psych package handles the transformation automatically and is widely used in psychometric research.
Reverse Scoring in Python
In Python with pandas, reverse scoring is a one-liner. Assuming your DataFrame is called “df” and the item is in the column “Q3”:
df[“Q3R”] = 8 – df[“Q3”]
For multiple columns at once, use a loop or list comprehension:
reverse_items = [“Q3”, “Q7”, “Q12”]
for item in reverse_items:
df[item + “R”] = 8 – df[item]
Reverse Scoring in Jamovi
Jamovi is a free, open-source statistical package with a spreadsheet-like interface. To reverse score:
Double-click your data file to open it in Jamovi.
Click the Data tab and select Transform on the variable you want to reverse.
In the transform dialog, select Reverse score from the transformation type dropdown.
Enter your scale minimum and maximum values (e.g., 1 and 7).
Jamovi creates a new transformed variable automatically.
Jamovi also supports the compute approach: click Compute, name the new variable, and type 8 – Q3 in the formula box.
How to Verify Your Reverse Scoring Worked
Before you run reliability analysis, verify that your reverse scoring was applied correctly. Our team always runs three quick checks.
Check 1: Range. The reverse-scored variable should have the same range as the original. If the original item ranges from 1 to 7, the reverse-scored version should also range from 1 to 7. If you see a value of 0 or 8, you used the wrong formula.
Check 2: Descriptive statistics. The mean of the reverse-scored variable should equal (midpoint times 2) minus the original mean. For a 1-7 scale, the midpoint is 4, so: reverse_mean = 8 – original_mean. If the original mean is 5.2, the reverse-scored mean should be 2.8.
Check 3: Correlation. Run a correlation between the original item and the reverse-scored version. The correlation should be exactly -1.0. If it is not, something went wrong in the transformation.
Check 4: Inter-item correlations. Run a correlation matrix on all items (using the reverse-scored versions for negative items). All correlations should now be positive if the scale measures a single construct. Any remaining negative correlations suggest you missed an item that needs reverse scoring.
Interpreting Reliability Output After Reverse Scoring
Once every negatively worded item has been reverse-scored and verified, you are ready to run reliability analysis. In SPSS, navigate to Analyze, then Scale, then Reliability Analysis. Move all items (using the reverse-scored versions for negative items) into the Items box. Select Alpha as the model and click Statistics to request item-total statistics and descriptive statistics for each item.
Cronbach’s Alpha Interpretation
Cronbach’s alpha ranges from 0 to 1, and common benchmarks for interpretation are:
0.90 or higher: Excellent internal consistency
0.80 to 0.89: Good internal consistency
0.70 to 0.79: Acceptable internal consistency
0.60 to 0.69: Questionable, may be acceptable in exploratory research
Below 0.60: Poor, items may need revision
If your alpha is below 0.70 after proper reverse scoring, the issue is likely with the scale itself, not the scoring. Items may be measuring different constructs, or some items may be ambiguously worded.
Item-Total Correlation
The corrected item-total correlation tells you how well each item correlates with the total score of the remaining items. A good item should show a correlation of at least 0.30. Items with correlations below 0.20 are candidates for removal.
Before reverse scoring, negatively worded items will show negative item-total correlations here. After proper reverse scoring, those same items should show positive correlations comparable to the rest of the scale. This is one of the clearest signals that your reverse coding worked.
Alpha if Item Deleted
This column tells you what Cronbach’s alpha would be if you removed each individual item. If removing an item would substantially increase alpha, that item may be poorly worded or measuring a different construct. As part of a complete scale development process, researchers use this statistic to refine their instrument by dropping problematic items.
One caution: if alpha if item deleted increases dramatically for a negatively worded item, double-check that the reverse scoring was applied correctly before deciding to drop the item. Sometimes the issue is a coding error, not the item itself.
Common Mistakes and Troubleshooting
Forum discussions on r/AskStatistics, r/spss, and r/AcademicPsychology reveal recurring problems with reverse scoring. Here are the most common mistakes and how to fix them.
Mistake 1: Negative Cronbach’s Alpha After Reverse Coding
If your alpha is negative after you applied reverse scoring, you likely reversed an item that did not need it, or you reversed the same item twice. Check your codebook again and verify that you only reverse-scored items the instrument developers flagged as negatively worded. Then run the inter-item correlation check described in the verification section to find any items still correlating negatively with the rest.
Mistake 2: Overwriting Original Data
Using “Recode into Same Variables” in SPSS replaces your original values permanently. If you make an error, you cannot recover the original data without reloading your file. Always use “Recode into Different Variables” or the Compute Variable method to create new variables. This is the single most common advice given by experienced researchers on forums.
Mistake 3: Forgetting to Update Both Sides of a Batch COMPUTE Statement
When using SPSS syntax for batch processing, every COMPUTE line needs a unique target variable name. A common error is writing “COMPUTE Q3 = 8 – Q3” which overwrites Q3 with the reversed value, making it impossible to verify the transformation later. Always use a different name: “COMPUTE Q3R = 8 – Q3.”
Mistake 4: Using the Wrong Formula for 0-Based Scales
The popular shortcut “max + 1 – x” assumes a minimum of 1. On a 0-4 scale, using “5 – x” instead of “4 – x” shifts all your scores by 1 point. Always use the general formula (min + max – x) and verify with a manual check on a few values before processing the full dataset.
Mistake 5: Mishandling Missing Values
If your scale uses a code like 99 or -1 for missing values, the reverse-scoring formula will treat those as valid scores and produce incorrect values (for example, 8 – 99 = -91). Define missing values in SPSS before running the COMPUTE command, or filter out missing cases first. In R, use na.rm handling. In Python, the pandas arithmetic will automatically propagate NaN values correctly.
Mistake 6: Not Knowing Which Items to Reverse
If your instrument did not come with a codebook, read every item carefully. An item needs reverse scoring if agreement with it indicates the opposite of what your overall scale measures. When in doubt, run an inter-item correlation matrix on the un-reversed data. Items that correlate negatively with the majority of other items are likely candidates for reverse scoring.
FAQs
How do you reverse score items?
To reverse score an item, subtract each response from one value higher than the scale maximum. For a 1-7 Likert scale, the formula is: new_score = 8 – old_score. This transforms 1 to 7, 7 to 1, 2 to 6, and leaves the midpoint of 4 unchanged. Always create a new variable rather than overwriting the original.
How to recode reverse scored items in SPSS?
In SPSS, go to Transform then Compute Variable. Enter a new variable name (like Q3R) in the Target Variable box. Type the formula (8 – Q3) in the Numeric Expression box. Click OK. For batch processing, use syntax: COMPUTE Q3R = 8 – Q3. COMPUTE Q7R = 8 – Q7. EXECUTE. Never use Recode into Same Variables because it overwrites your original data.
How to reverse score items in Excel?
In Excel, create a new column next to your original item data. If the original values are in cell B2 and you are using a 1-7 scale, enter the formula =8-B2 in the adjacent cell. Copy the formula down the column. For a 1-5 scale use =6-B2, and for a 0-4 scale use =4-B2.
What is reverse scoring in Likert scale?
Reverse scoring on a Likert scale means mathematically flipping the response values of negatively worded items so that a high score indicates the same direction across all items. For example, on a 1-5 scale, a response of 1 becomes 5 and a response of 5 becomes 1. This ensures all items measure the construct in the same direction before computing reliability statistics like Cronbach alpha.
Conclusion
You must reverse-score items before running reliability analysis. The formula is simple: reverse_score(x) = (max + min) – x, or for 1-based scales, (max + 1) – x. Apply it to every negatively worded item, verify the transformation with descriptive statistics and correlations, and only then run your Cronbach’s alpha. This single step prevents the most common and most damaging error in survey-based research: artificially low or negative reliability coefficients caused by un-reversed items.
Once your reliability analysis confirms acceptable internal consistency, you can proceed to compute total or mean scores for your scale and move forward with validity testing. For a complete walkthrough of the full pipeline, from item pool creation through expert review and validity and reliability analysis steps, published scale development studies provide useful templates to follow.