
Choosing the right statistical test can make or break your research conclusions. Pick the wrong one, and you could end up with misleading p-values, false discoveries, or missed effects that actually matter. The single most common decision point researchers face is whether to use a parametric test or a non-parametric test.
The difference between parametric and nonparametric tests comes down to one core question: does your data follow a specific distribution, usually the normal distribution? Parametric tests assume it does, while non-parametric tests, also called distribution-free tests, do not require that assumption. This single distinction affects everything from how the test handles outliers to how much statistical power you get from your sample.
I have spent years running statistical analyses across academic research, UX studies, and business analytics. In that time, I have seen the same confusion repeat itself in Reddit threads, classroom settings, and professional research teams alike. People worry about whether they should “play it safe” with non-parametric tests, or they feel pressured into using parametric tests without checking their assumptions.
This guide breaks down both approaches in plain language. You will learn what each test type actually does, when to use which one, how to check your data for normality, and how to avoid the most common mistakes that lead to invalid results. Whether you are working on a thesis, analyzing clinical trial data, or running A/B tests for a product team, this guide will help you make the right call.
By the end, you will have a clear decision framework you can apply to any dataset, plus answers to the most frequently asked questions about parametric and non-parametric testing.
Table of Contents
What Are Parametric Tests?
Parametric tests are statistical tests that assume your data follows a known probability distribution, most commonly the normal distribution, often described as a bell-shaped curve. These tests focus on estimating and comparing population parameters such as the mean and the standard deviation.
The word “parametric” refers to the parameters of the underlying distribution. When you run a t-test or an ANOVA, you are implicitly assuming that the population your sample came from has a specific shape. The test then uses that assumed shape to calculate probabilities and p-values.
For a parametric test to produce valid results, your data needs to meet several assumptions. The observations should be independent of one another. The data should be measured on at least an interval scale, meaning the distances between values are meaningful. The variance across groups should be roughly equal, a property called homogeneity of variance. And critically, the residuals, or the differences between observed and expected values, should follow a normal distribution.
When those assumptions hold, parametric tests are extremely powerful. They can detect real effects with smaller sample sizes than non-parametric alternatives. A paired t-test on normally distributed data, for example, will generally outperform a Wilcoxon signed-rank test on the same dataset because it uses more information from the actual values rather than converting them to ranks.
Parametric tests are the default in most statistical software packages, and they are what most introductory statistics courses teach first. That widespread familiarity makes them a strong default choice when their assumptions are genuinely met.
What Are Non-Parametric Tests?
Non-parametric tests are statistical tests that do not require your data to follow any specific probability distribution. For this reason, they are often called distribution-free tests. Instead of working with the raw values and their relationship to a theoretical curve, non-parametric tests typically convert your data into ranks and then analyze those ranks.
There is a common misconception that “non-parametric” means “no parameters.” In reality, as statisticians on Reddit and in academic forums frequently point out, non-parametric means the procedure does not rely on a fixed set of population parameters. Some statisticians describe it as involving many, perhaps infinitely many, parameters rather than none at all.
Because non-parametric tests do not assume a normal distribution, they are well-suited for data that is skewed, has outliers, or comes from an unknown distribution. They also work naturally with ordinal data, where values represent ranked categories rather than measurable quantities. Think of survey responses on a Likert scale, or customer satisfaction ratings from one to five.
The trade-off is that non-parametric tests generally have less statistical power than their parametric counterparts when the parametric assumptions are actually met. By converting raw values to ranks, you lose information about the magnitude of differences between values. Two data points that are far apart in actual measurement end up just one rank apart, the same as two points that are barely different.
Non-parametric tests compare medians rather than means. This makes them robust against extreme values. A single outlier in a small dataset can dramatically shift a mean, but it will only shift a median by one rank position. For research involving small samples from unknown distributions, that robustness is genuinely valuable.
Parametric vs Non-Parametric: Key Differences
The difference between parametric and nonparametric tests can be understood through three core categories that researchers use to make decisions.
1. Underlying Assumptions
Parametric tests assume your data follows a normal distribution with equal variances across groups. They also assume that observations are independent and that the data is measured on an interval or ratio scale. If any of these assumptions are violated, the validity of your p-values is at risk.
Non-parametric tests make few or no assumptions about the shape of the population distribution. They do not require normality, and many of them do not require equal variances. This makes them more flexible, but it also means they are working with less specific information about your data.
2. Central Tendency and Data Type
Parametric tests focus on the mean as the measure of central tendency. They compare group means and use the standard deviation to assess variability. This works well when the mean accurately represents the center of your data, which is true for symmetric distributions.
Non-parametric tests focus on the median. They compare ranks rather than actual values, which means they are better suited for skewed distributions where the mean gets pulled toward outliers. Non-parametric tests also handle ordinal data naturally, while parametric tests technically require interval or ratio data.
3. Statistical Power and Reliability
Parametric tests generally have higher statistical power when their assumptions are met. They can detect true effects with smaller sample sizes because they use the full information in your data. A parametric test might find a significant result with 30 participants where the non-parametric equivalent needs 35 or 40.
Non-parametric tests sacrifice some power in exchange for flexibility. When your data is non-normal, however, that sacrifice is worth it because the parametric test would be producing unreliable results anyway. The key insight is that a less powerful test on valid data always beats a more powerful test on violated assumptions.
Side-by-Side Comparison Summary
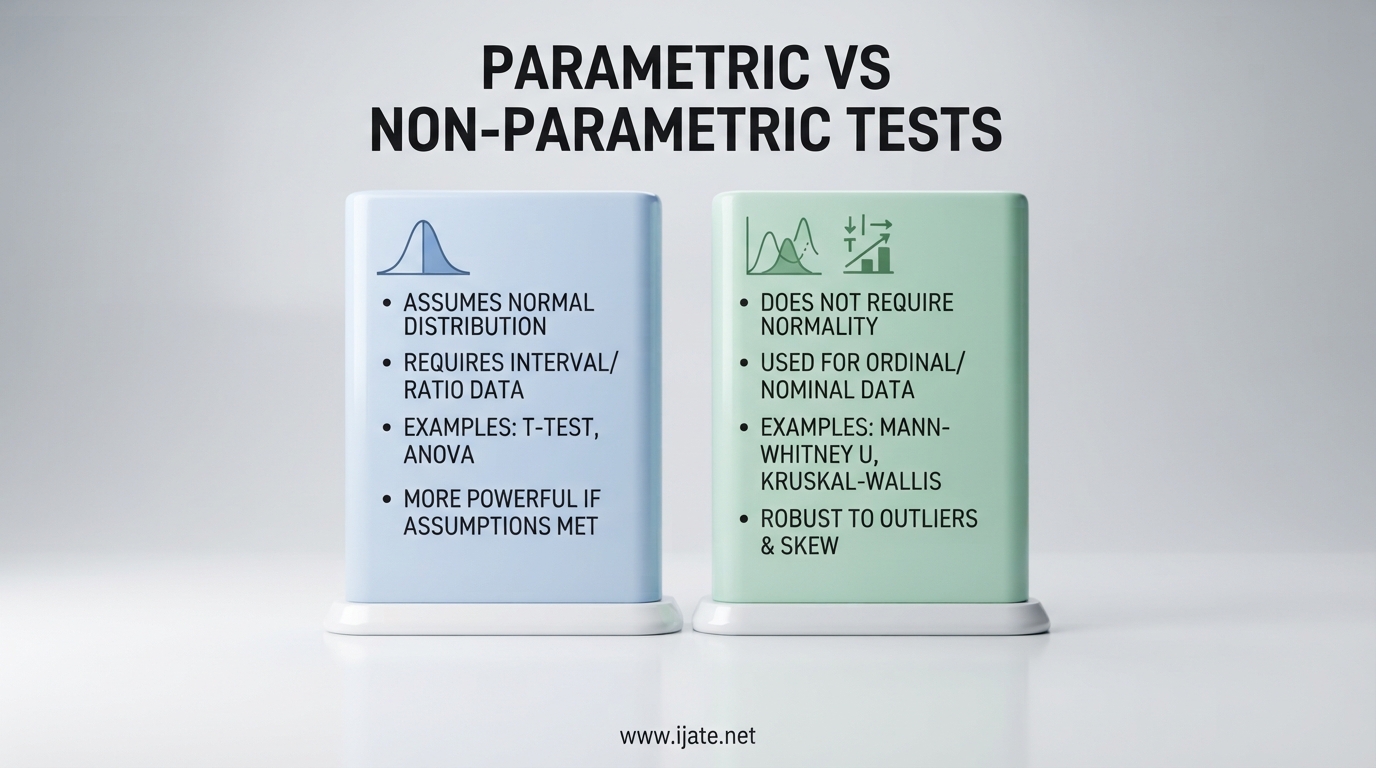
Parametric tests use means, require normal distributions, need interval or ratio data, assume equal variances, are sensitive to outliers, and offer higher statistical power when assumptions hold. Non-parametric tests use medians, require no distributional assumptions, work with ordinal or ranked data, do not need equal variances, are robust to outliers, and offer lower but more reliable power on non-normal data.
Common Types of Parametric Tests
There are several parametric tests you will encounter regularly in research and data analysis. Each is designed for a specific comparison scenario.
Independent Samples t-test
This test compares the means of two independent groups. For example, you might compare the test scores of students taught with Method A versus Method B. The test assumes both groups are normally distributed with equal variances.
Paired Samples t-test
This version compares two related measurements, such as before-and-after scores from the same participants. It tests whether the mean difference between paired observations is significantly different from zero.
One-Way ANOVA (Analysis of Variance)
ANOVA extends the t-test to three or more groups. If you are comparing customer satisfaction scores across four different product versions, a one-way ANOVA tests whether any group mean differs significantly from the others. ANOVA is a parametric test because it assumes normally distributed residuals and equal variances across groups.
Pearson Correlation Coefficient
Pearson correlation measures the strength and direction of a linear relationship between two continuous variables. It assumes both variables are normally distributed and the relationship is linear.
Linear Regression
Linear regression models the relationship between a dependent variable and one or more independent variables. It assumes normally distributed residuals, linearity, independence of observations, and homoscedasticity, which means constant variance of residuals across predicted values.
Common Types of Non-Parametric Tests
Non-parametric tests serve as alternatives to their parametric counterparts. Each one is designed to handle a similar comparison scenario without relying on distributional assumptions.
Mann-Whitney U Test
This is the non-parametric alternative to the independent samples t-test. It compares two independent groups by ranking all observations together and testing whether ranks are distributed differently across groups. Use it when comparing two groups on an ordinal variable or when normality fails.
Wilcoxon Signed-Rank Test
The Wilcoxon signed-rank test is the non-parametric counterpart to the paired samples t-test. It compares two related samples by ranking the absolute differences between pairs and testing whether positive and negative differences are balanced. KNIME forum users and R programmers frequently turn to this test when paired data fails normality checks.
Kruskal-Wallis Test
This is the non-parametric alternative to one-way ANOVA. It compares three or more independent groups by ranking all observations and testing for differences in rank distributions. It is useful when you have multiple groups with skewed or ordinal data.
Chi-Square Test
The chi-square test examines whether there is a significant association between two categorical variables. It compares observed frequencies in a contingency table against the frequencies you would expect if the variables were independent. This test is inherently non-parametric because it works with counts rather than distributional assumptions.
Spearman Rank Correlation
Spearman correlation is the non-parametric alternative to Pearson correlation. Instead of measuring linear relationships between raw values, it measures monotonic relationships between ranks. Use it when your data is ordinal or when the relationship between two variables is curvilinear but still consistently increasing or decreasing.
Friedman Test
The Friedman test is the non-parametric alternative to repeated-measures ANOVA. It compares three or more related groups, such as measurements taken under different conditions on the same participants. It ranks each participant’s scores across conditions and tests for overall differences.
When to Use Parametric vs Non-Parametric Tests
Deciding between parametric and non-parametric tests is the most frequent question in statistics forums, and there is a simple decision framework that handles the majority of cases.
Step 1: Check Your Data Type
If your data is nominal or ordinal, start with non-parametric tests. Chi-square tests handle categorical associations, and rank-based tests like Mann-Whitney and Kruskal-Wallis handle ordinal comparisons naturally. If your data is interval or ratio, you can consider both options.
Step 2: Test for Normality
For interval or ratio data, run a normality test. Use visual methods like a Q-Q plot and statistical methods like the Shapiro-Wilk test. If your data is normally distributed, a parametric test is appropriate. If normality is violated and cannot be fixed through transformation, switch to the non-parametric equivalent.
Step 3: Consider Sample Size
With large samples, typically above 30 per group, the Central Limit Theorem means parametric tests become robust to non-normality. The sampling distribution of the mean approaches normal even when the underlying data is not. For small samples, especially below 15 per group, non-parametric tests are often safer because normality tests lack power to detect violations.
Step 4: Check for Outliers
If your data contains extreme outliers that cannot be removed or explained, non-parametric tests are the better choice. Outliers distort means and standard deviations, which are the foundation of parametric tests. Non-parametric tests, by working with ranks, are largely immune to this distortion.
Addressing the “Always Use Non-Parametric” Misconception
One of the most common questions on Reddit’s statistics community is whether you should always use non-parametric tests to be safe. The answer is no. Defaulting to non-parametric tests when parametric assumptions are actually met means you are throwing away statistical power for no reason. You increase your risk of Type II errors, which means failing to detect a real effect.
The better approach is to check your assumptions and choose accordingly. Non-parametric tests are a tool for specific situations, not a universal safety net. Researchers who automatically reach for them are often doing so out of uncertainty about assumption checking rather than genuine data-driven reasoning.
How to Test for Normality
Testing for normality is the practical bridge between theory and decision-making. There are two main approaches, and using both together gives you the most reliable assessment.
Visual Methods
A Q-Q plot, short for quantile-quantile plot, plots your data’s quantiles against the quantiles of a theoretical normal distribution. If your data is normally distributed, the points fall roughly along a straight diagonal line. Deviations from that line indicate departures from normality. Q-Q plots are especially useful because they show you where and how your data deviates from normality, not just whether it does.
A histogram with a normal curve overlay is another visual option. It gives you a quick sense of the overall shape, but it is less precise than a Q-Q plot for detecting subtle deviations.
Statistical Methods
The Shapiro-Wilk test is the most commonly recommended formal test for normality. It tests the null hypothesis that your data comes from a normal distribution. A p-value below your significance level, typically 0.05, means you reject normality. The test works well for sample sizes between roughly 3 and 5,000.
The Kolmogorov-Smirnov test is another option, but it is generally less powerful than Shapiro-Wilk for detecting departures from normality. Some analysts use the Anderson-Darling test as well, which gives more weight to deviations in the tails of the distribution.
A Practical Warning About Normality Tests
With very large samples, normality tests become overly sensitive. They will flag tiny, practically meaningless deviations as statistically significant. With very small samples, the opposite problem occurs. The tests lack the power to detect real violations. This is why combining visual inspection with statistical testing is the recommended approach, rather than relying on a p-value alone.
Advantages and Disadvantages of Each Approach
Both parametric and non-parametric tests have genuine strengths and limitations. Understanding both sides helps you make informed decisions rather than default choices.
Advantages of Parametric Tests
Parametric tests offer higher statistical power when their assumptions are met, meaning they can detect real effects with smaller samples. They produce confidence intervals and effect size estimates that are straightforward to interpret. They are widely understood and expected in most academic and professional settings. The results generalize to the population parameters they estimate.
Parametric tests also handle complex designs more naturally. Factorial ANOVA, repeated measures with covariates, and multivariate techniques all have well-developed parametric frameworks. The non-parametric equivalents for these complex designs are often limited or less familiar.
Disadvantages of Parametric Tests
The main disadvantage is assumption dependence. If your data violates normality, equal variance, or independence assumptions, parametric tests can produce misleading results. A significant p-value might reflect a violation rather than a real effect. Parametric tests are also sensitive to outliers, which can inflate or deflate means and distort standard deviations.
Advantages of Non-Parametric Tests
Non-parametric tests are robust. They handle skewed distributions, outliers, and small samples without breaking down. They work naturally with ordinal data, which parametric tests technically cannot handle. They are often easier to explain to non-technical audiences because the ranking concept is intuitive.
Non-parametric tests also do not require equal variances across groups, which removes one common source of assumption violation. For exploratory research where you know little about your data’s properties, they provide a defensible analysis path.
Disadvantages of Non-Parametric Tests
The primary drawback is reduced statistical power. By converting raw values to ranks, you lose information about the magnitude of differences. Non-parametric confidence intervals are less commonly reported and sometimes harder to interpret. Some complex experimental designs lack straightforward non-parametric equivalents.
Non-parametric tests can also mask important patterns. If two groups have identical rank distributions but very different spreads, a rank-based test might miss differences that a parametric test would catch.
Real-World Research Examples
To make these concepts concrete, here are two real-world scenarios that researchers commonly face.
Biomedical Research Example
A spine research team at a clinical institution wants to compare pain scores between two treatment groups. Pain scores are measured on a 0 to 10 visual analog scale, which is ordinal in nature. The sample size is 18 patients per group, and the data is right-skewed because most patients report low pain but a few report very high pain.
In this scenario, a parametric independent t-test would be inappropriate because the data is ordinal, non-normal, and from a small sample. The correct choice is the Mann-Whitney U test, which compares rank distributions without assuming normality. This is exactly the type of scenario documented in peer-reviewed literature on parametric and nonparametric tests in clinical research.
UX Research Example
A UX team runs an A/B test comparing task completion times across two interface designs. They collect data from 500 participants per variant. The completion time data is heavily right-skewed because most users finish quickly while a few take much longer.
Despite the skewness, the large sample size means the Central Limit Theorem applies. The sampling distribution of the mean will be approximately normal, making an independent t-test valid. Alternatively, the team could use a Mann-Whitney U test, but with 500 participants per group, the power difference between the two approaches is negligible. Either test would reliably detect a meaningful difference if one exists.
Common Mistakes to Avoid
Researchers make several recurring mistakes when choosing between parametric and non-parametric tests. Avoiding these will keep your analyses sound.
Mistake 1: Skipping the Normality Check
Many researchers default to parametric tests without ever testing whether their data meets the normality assumption. This is the equivalent of building a house without checking the foundation. Always run a normality assessment before committing to a parametric test, especially with smaller samples.
Mistake 2: Using Non-Parametric Tests as a Default Safety Net
As discussed earlier, defaulting to non-parametric tests sacrifices statistical power unnecessarily when assumptions are met. Check your data first, then choose.
Mistake 3: Ignoring Sample Size Context
With large samples, parametric tests become robust to non-normality through the Central Limit Theorem. With small samples, normality tests may lack the power to detect real violations. Always interpret your normality results in the context of your sample size.
Mistake 4: Treating Ordinal Data as Interval
Computing means and standard deviations on Likert-scale data is technically inappropriate, even though it is widely done. If your data is ordinal, consider whether rank-based non-parametric tests are more appropriate for your analysis goals.
FAQs
How to know if a test is parametric or non-parametric?
A test is parametric if it assumes your data follows a specific distribution, usually the normal distribution, and works with population parameters like the mean. A test is non-parametric if it does not require distributional assumptions and typically works with ranks or medians instead. Check the test documentation or look at whether it compares means (parametric) or medians and ranks (non-parametric).
What is the difference between parametric and nonparametric tests in biomedical research?
In biomedical research, parametric tests like t-tests and ANOVA assume normally distributed data measured on interval or ratio scales, making them suitable for outcomes like blood pressure or lab values. Non-parametric tests like Mann-Whitney U and Kruskal-Wallis are used for skewed data, small clinical samples, ordinal outcome measures like pain scores, or when outliers are present. Choosing the wrong type can lead to invalid conclusions about treatment efficacy.
Is ANOVA a parametric or non-parametric test?
ANOVA, or Analysis of Variance, is a parametric test. It assumes that residuals are normally distributed, that group variances are approximately equal, and that observations are independent. For situations where these assumptions are violated, the Kruskal-Wallis test serves as the non-parametric alternative to one-way ANOVA.
What are 5 tests that can be used for non-parametric statistics?
The five most common non-parametric tests are: 1) Mann-Whitney U test for comparing two independent groups, 2) Wilcoxon signed-rank test for comparing two related samples, 3) Kruskal-Wallis test for comparing three or more independent groups, 4) Chi-square test for testing associations between categorical variables, and 5) Spearman rank correlation for measuring monotonic relationships between two variables.
Conclusion
Understanding the difference between parametric and nonparametric tests is one of the most practical skills in statistical analysis. Parametric tests assume normality, work with means, and offer higher power when their assumptions hold. Non-parametric tests, also called distribution-free tests, work with medians and ranks, handle non-normal and ordinal data, and provide reliable results when parametric assumptions fail.
The key takeaway is that neither approach is universally better. The right choice depends on your data type, distribution shape, sample size, and the presence of outliers. Always check your assumptions before committing to a test, and remember that a less powerful test applied to valid conditions always outperforms a more powerful test applied to violated assumptions.
If you are working through a specific dataset right now, start by testing for normality using a Q-Q plot and the Shapiro-Wilk test. Then walk through the decision framework outlined in this guide. That systematic approach will lead you to the correct test far more reliably than defaulting to either category out of habit.
Statistics is not about memorizing rules. It is about understanding your data and choosing methods that respect its properties. Once you internalize that mindset, the choice between parametric and non-parametric tests becomes straightforward rather than intimidating.