
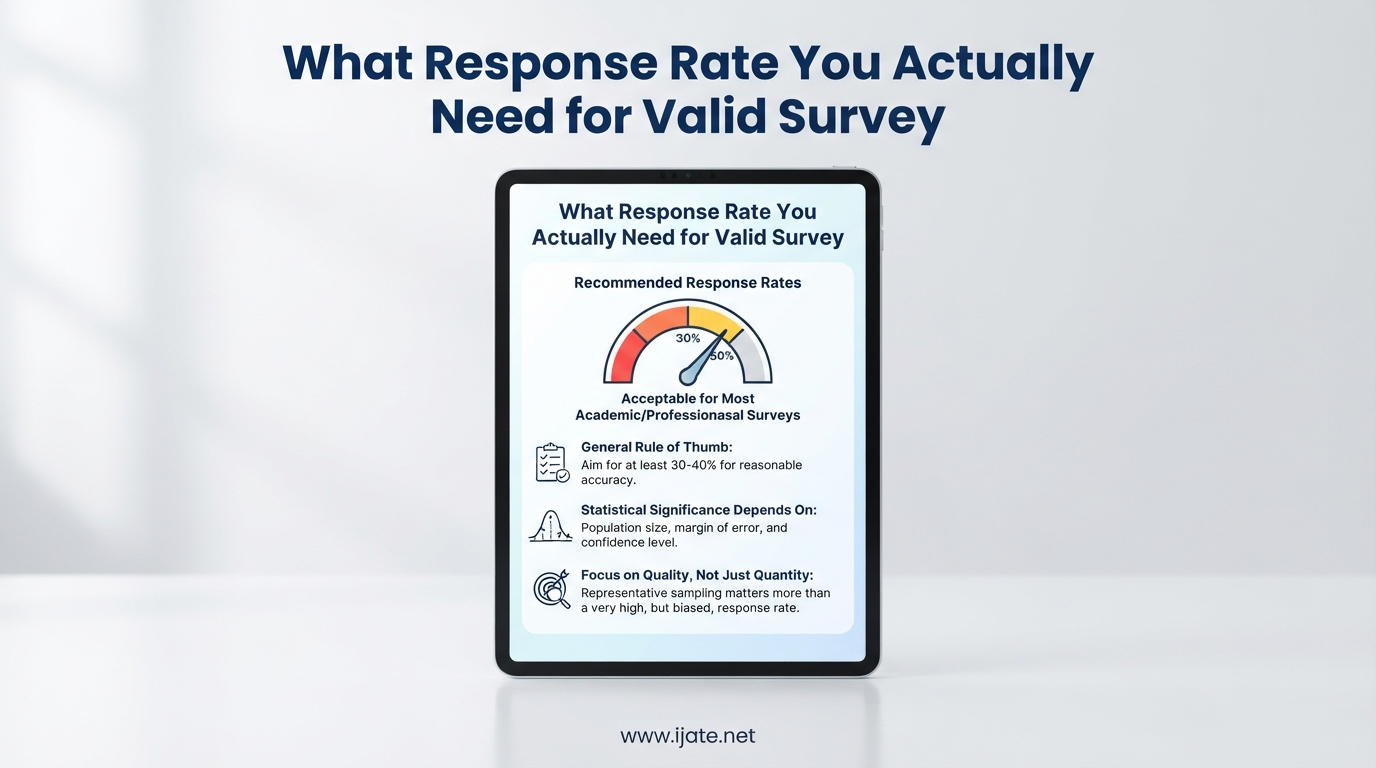
Here is the truth most survey guides bury in paragraph six: the response rate percentage is not what makes a survey valid. What matters is whether you collected enough absolute responses to draw conclusions within an acceptable margin of error. A 5% response rate from a population of 100,000 gives you 5,000 responses, which is more than enough for most research. A 60% response rate from a population of 50 gives you just 30 responses, which limits what you can confidently claim.
That single distinction reframes the entire conversation. People ask what response rate you actually need for a valid survey expecting a single number, but the answer depends on population size, desired confidence level, and acceptable margin of error. Once you understand that, survey validity stops being a guessing game.
I have spent years reviewing survey methodology across customer feedback programs, employee engagement studies, and academic research. The pattern is always the same. Researchers fixate on hitting a percentage threshold, then discover their data is still unreliable because the absolute number of responses was too small. Or worse, they throw out perfectly good data because the percentage looked low.
This guide breaks down exactly what response rate you need, when low rates are still statistically valid, and how to calculate whether your results can be trusted. We will cover the formula, the thresholds by survey type, the often-misunderstood Rule of 5, and practical steps to push your numbers higher.
Table of Contents
What Is a Survey Response Rate?
A survey response rate is the percentage of invited participants who completed your survey. It measures how many people out of your total sample actually engaged with your questions. This is different from completion rate, which measures how many people who started the survey finished it.
The distinction matters more than most people realize. A high completion rate with a low response rate means your survey is easy to finish but few people opened it. A high response rate with a low completion rate means lots of people started but abandoned it halfway. Both metrics tell you something different about your survey design.
Response rate tells you about reach and willingness to participate. Completion rate tells you about survey length and friction. For statistical validity, we care about the response rate, because that determines how many completed responses we have to work with.
What Response Rate You Actually Need for a Valid Survey
The short answer is that a good survey response rate falls between 10% and 30% for external online surveys, while internal employee surveys should aim for 50% or higher. Anything above 30% for external audiences is considered excellent. But these ranges are starting points, not universal rules.
Different survey types have different expectations. Here is a breakdown of typical response rate benchmarks our team has observed across industries in 2026:
- External customer surveys: 10 to 30% is acceptable, with 25%+ being strong
- Internal employee surveys: 50% or higher, with 70%+ being excellent
- NPS surveys: 15 to 30% transactional, 10 to 20% relational
- CSAT surveys: 20 to 40% for post-interaction surveys
- CES surveys: 15 to 30% depending on touchpoint
- Market research surveys: 5 to 15% for cold external panels
- Academic research surveys: 50 to 60% should be the goal per published research standards
Notice the spread. Internal surveys almost always see higher response rates because employees feel more obligated and the audience is captive. External surveys face competition for attention, skepticism about how data will be used, and simple indifference.
Here is what matters more than the percentage: whether your responses represent a meaningful cross-section of your population. A 15% response rate from a customer base of 50,000 gives you 7,500 responses. If those respondents span different segments, regions, and purchase behaviors, you have a statistically valid dataset. A 50% response rate from the same base gives you 25,000 responses, but if they all come from one demographic, your data is biased regardless of the impressive percentage.
How Many Responses Do You Actually Need?
This is where most guides lose people in statistics jargon. Let me keep it practical. The number of responses you need depends on three things: your total population size, your desired confidence level (usually 95%), and your acceptable margin of error (usually 5%).
At a 95% confidence level with a 5% margin of error, here is roughly how many completed responses you need based on population size:
- Population of 100: approximately 80 responses
- Population of 500: approximately 218 responses
- Population of 1,000: approximately 278 responses
- Population of 5,000: approximately 357 responses
- Population of 10,000: approximately 370 responses
- Population of 100,000: approximately 383 responses
- Population of 1,000,000+: approximately 384 responses
Read that list carefully. Notice what happens as population size grows. The number of responses you need does not scale linearly. Once your population exceeds about 100,000, you still only need around 384 responses for a 5% margin of error at 95% confidence. This is the statistical principle that makes national political polling work with surprisingly small samples.
This is why fixating on response rate percentage alone is misleading. If you have a customer base of 100,000 and a 1% response rate, you still have 1,000 completed responses. That far exceeds the 384 needed for a 5% margin of error. Your survey is statistically valid on paper, assuming no major non-response bias.
Now, if you want a tighter 3% margin of error at the same confidence level, you need approximately 1,067 responses for large populations. Drop to a 1% margin of error and you need around 9,604. Every reduction in margin of error requires a quadratically larger sample.
The practical takeaway: decide what decisions you need to make from the data, determine how much error you can tolerate in those decisions, and calculate backward to find your required sample size. Then figure out what response rate you need to hit that sample.
The Rule of 5 and Minimal Sample Sizes
Here is a concept that almost no survey guides cover but every researcher should know. The Rule of 5 comes from applied statistics and lean research methodologies. It states that even 5 responses can give you directional insight about a population.
The math is simple. If 5 out of 5 people give the same answer, there is a 93.75% probability that the majority of your population would answer the same way. That is not rigorous enough for academic publication, but it is more than enough to spot a glaring problem or confirm an obvious pattern.
I have used this in practice. When rolling out a new survey format internally, we tested it with 5 colleagues first. If all 5 found a question confusing, we rewrote it. We did not need 384 responses to know the question was broken.
The Rule of 5 does not replace proper sample size calculation for definitive research. But it is a powerful tool for rapid feedback, pilot testing, and early-stage hypothesis exploration. It also serves as a reminder that the value of a response depends on what you are trying to learn, not just on hitting a statistical threshold.
For quantitative claims meant to inform business decisions or academic conclusions, you still need the full sample size. For directional gut-checks, the bar is much lower than most people assume.
When Low Response Rates Are Still Valid
This section addresses one of the most persistent myths in survey research: that a low response rate automatically invalidates your results. It does not.
Consider political polling. National polls in the United States routinely achieve response rates below 1%, sometimes as low as 0.1%. Yet these polls accurately predict election outcomes because they collect enough absolute responses from a carefully sampled population. A response rate of 0.5% from a population of 240 million adults yields over a million responses, far exceeding the sample size needed for tight margins of error.
The key is that those respondents are selected to represent the broader population through weighting and stratification. The low percentage is irrelevant because the absolute numbers and the sampling methodology are sound.
In our own work, we have seen companies panic over a 39% response rate on an employee survey of 18,000 people. That is over 7,000 responses, which is enormous by any standard. The real question was not whether 39% was high enough. It was whether the 61% who did not respond differed systematically from those who did. That is a question about bias, not response rate.
Here is the framework I use to evaluate whether a low response rate is acceptable. First, do you have enough absolute responses to meet your margin of error requirement? Second, are the respondents representative of your population across key demographics or segments? Third, have you checked for non-response bias by comparing early responders to late responders? If the answer to all three is yes, your survey is valid regardless of the percentage.
One important caveat: for academic research and peer-reviewed studies, journals and institutional review boards often expect response rates of 50% or higher. This is a methodological convention, not a statistical requirement. If you are publishing academic work, check the standards of your target journal.
Non-Response Bias: The Hidden Threat
Non-response bias is what actually invalidates surveys, not low response rates themselves. It occurs when the people who respond to your survey differ systematically from those who do not. If your satisfied customers respond at higher rates than dissatisfied ones, your results will paint an overly rosy picture.
This happens more often than people think. Very happy and very unhappy customers respond to surveys at higher rates than the neutral middle group. If you only hear from the extremes, your average scores will look more polarized than reality.
You can test for non-response bias using a few techniques. Compare the demographics of your respondents to your known population. Run a wave analysis comparing early responders to late responders, since late responders often resemble non-respondents more closely. If the two groups show similar results, you have evidence that non-response bias is minimal.
Another approach is to follow up with a small sample of non-respondents using a different method, like a phone call or shorter survey. If their answers align with your respondent pool, your confidence increases.
The bottom line: a 70% response rate with non-response bias is less reliable than a 15% response rate without it. Always evaluate representativeness alongside response rate.
How to Calculate Your Survey Response Rate
The response rate formula is straightforward. Divide the number of completed responses by the number of people invited to take the survey, then multiply by 100.
Response Rate = (Completed Surveys / Survey Invitations Sent) x 100
For example, if you email a survey to 2,000 customers and 340 complete it, your response rate is (340 / 2,000) x 100 = 17%.
The tricky part is defining what counts as a completed survey. Some teams count anyone who opened the survey. Others only count those who answered every question. We recommend counting respondents who completed enough questions to be usable for your analysis. Define this threshold before you launch, not after.
Be careful not to confuse response rate with completion rate. Completion rate is (Completed Surveys / Started Surveys) x 100. If 500 people start your survey and 340 finish it, your completion rate is 68%. But if you sent the survey to 2,000 people, your response rate is still 17%.
Track both metrics. Response rate tells you about your outreach effectiveness. Completion rate tells you about your survey design. Improving the wrong one wastes effort.
8 Ways to Increase Your Survey Response Rate
If you have calculated your required sample size and your current response rate will not get you there, here are proven methods to close the gap.
1. Keep your survey short. Surveys under 5 minutes see dramatically higher completion rates. Every additional question reduces responses. Cut anything that is not essential to your core research question.
2. Send personalized invitations. A plain text email from a real person outperforms a branded HTML template almost every time. People respond to people, not corporate communications.
3. Use follow-up reminders. Send two to three reminders to non-respondents spaced several days apart. The second reminder typically generates nearly as many responses as the initial invitation.
4. Optimize for mobile. Over half of survey responses now come from mobile devices. If your survey is not mobile-friendly, you are losing responses before people even read the first question.
5. Offer incentives thoughtfully. Small incentives like gift cards or discount codes can boost response rates significantly. Be aware that incentives can attract professional survey takers in external panels, so weight this against your data quality needs.
6. Be transparent about time commitment. Tell people exactly how long the survey takes. Saying it takes 3 minutes and actually taking 10 destroys trust and tanks completion rates.
7. Time your invitations strategically. Tuesday through Thursday mornings consistently outperform other send times. Avoid Mondays, Fridays, and weekends for business audiences.
8. Close the loop. If you have surveyed people before, share what you did with their feedback. People are far more likely to respond again when they see their input led to action.
FAQs
What is an acceptable response rate for a survey?
An acceptable response rate for external online surveys is 10 to 30%, while internal employee surveys should aim for 50% or higher. NPS surveys typically see 15 to 30%, and market research panels often average 5 to 15%. Anything above 30% for external surveys is considered excellent.
How many responses are needed for a valid survey?
For a 95% confidence level with a 5% margin of error, you need approximately 384 responses for populations over 100,000. Smaller populations need proportionally fewer responses. Calculate your required sample size based on your population, confidence level, and acceptable margin of error rather than relying on a fixed percentage.
Is 10% sample size acceptable?
A 10% response rate can be acceptable if the absolute number of responses meets your sample size requirement. For example, 10% of 50,000 is 5,000 responses, which far exceeds the roughly 384 needed for statistical validity at a 5% margin of error. The key is whether you have enough responses and whether they are representative of your population.
Is 50 responses enough for a survey?
Fifty responses can be enough for directional insights and small populations, but it is below the 384 needed for a 5% margin of error at 95% confidence in large populations. For small populations under 100, fifty responses may be sufficient. For quantitative claims in business or research, aim for at least 200 to 400 responses depending on your population size.
Conclusion
The question of what response rate you actually need for a valid survey has a more nuanced answer than a single percentage. Focus first on whether you have enough absolute responses to meet your margin of error target. Then verify that your respondents are representative of your broader population. Only then does the response rate percentage become a useful secondary metric.
Aim for 10 to 30% on external surveys and 50% or higher on internal ones, but treat those as benchmarks rather than pass-fail thresholds. The most important step you can take right now is calculating your required sample size for your specific population and confidence needs. Once you know that number, your target response rate becomes obvious. Everything else is execution.