
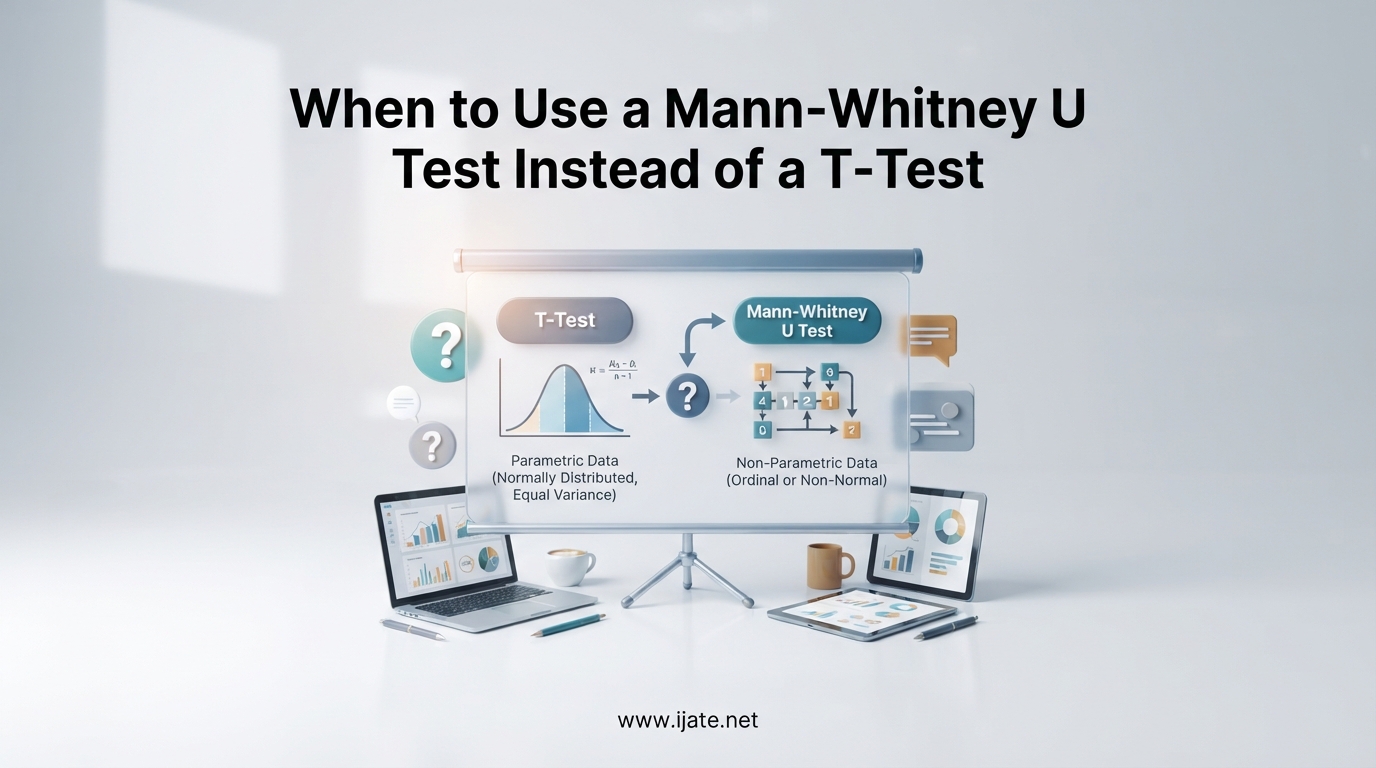
Choosing the wrong statistical test can quietly invalidate hours of research. I have seen graduate students defend entire theses built on a t-test that should have been a Mann-Whitney U, and I have watched A/B testers ship features based on p-values that meant nothing. The good news is that the decision between these two tests comes down to a handful of checkable assumptions, not advanced math.
In this guide, I will walk through exactly when to use a Mann-Whitney U test instead of a t-test. I will cover what each test assumes, how to check your data for normality, what to do when results disagree, and how Welch’s t-test fits into the picture as a practical middle ground.
Whether you are running clinical trials, psychology surveys, or product experiments, by the end you will have a clear framework for picking the right test every time. For a deeper look at statistical analysis methods in published research, the same principles apply across disciplines.
Table of Contents
What Is the Mann-Whitney U Test?
The Mann-Whitney U test (also called the Wilcoxon rank-sum test) is a non-parametric statistical test used to compare two independent groups when your data does not meet the assumptions required for a t-test. Instead of comparing group means, it ranks all observations from both groups together and compares the sum of those ranks.
Think of it this way. A t-test asks whether the average values of two groups differ. The Mann-Whitney U test asks whether values from one group tend to be systematically higher or lower than the other group. That distinction matters most when your data has outliers, is measured on an ordinal scale, or follows a distribution that looks nothing like a bell curve.
Because the test operates on ranks rather than raw values, a single extreme outlier barely moves the result. The largest value in your dataset gets the highest rank whether it is 100 or 100,000. This rank-based approach makes the Mann-Whitney U test what statisticians call a distribution-free test, meaning it does not assume any specific underlying distribution shape.
T-Test Assumptions You Need to Understand
The independent samples t-test is a parametric test, which means it makes specific assumptions about the population your data came from. When those assumptions hold, the t-test is more powerful than its non-parametric counterpart. It detects real differences with smaller sample sizes. When those assumptions break down, the t-test can produce misleading p-values, confidence intervals that are too narrow, or both.
Here are the four core assumptions of the independent samples t-test:
- Normality: The data in each group should follow an approximately normal distribution. This matters most with small samples (under 30 per group).
- Independence: Observations within and between groups must be independent. One participant’s response should not influence another’s.
- Continuous scale: The dependent variable should be measured on a continuous interval or ratio scale (like height, weight, or time).
- Homogeneity of variance: Both groups should have roughly equal variances. When this fails, Welch’s t-test (covered below) is the standard fix.
The normality assumption is where most researchers get tripped up. Real-world data is rarely perfectly normal. Income data is right-skewed. Reaction times follow a log-normal shape. Survey Likert scales are ordinal, not continuous. The question is not whether your data is perfectly normal, but whether it is normal enough for the t-test to give trustworthy results.
As a rough rule from the Central Limit Theorem, the t-test becomes increasingly robust to non-normality as sample sizes grow. With 30 or more observations per group, mild deviations from normality rarely matter. With fewer than 15 observations per group, even moderate skew can cause problems.
Mann-Whitney U Test Assumptions
The Mann-Whitney U test has fewer and less restrictive assumptions than the t-test. That simplicity is exactly what makes it the safer fallback. Here is what it requires:
- Independence: Same as the t-test, observations must be independent within and between groups.
- Ordinal or continuous data: The variable can be measured on an ordinal, interval, or ratio scale. This is more flexible than the t-test, which needs continuous data.
- Similar distribution shape: For the test to compare medians meaningfully, both groups should have similarly shaped distributions. If shapes differ substantially, the test technically evaluates whether one distribution is stochastically larger than the other.
- Random sampling: Both samples should be randomly drawn from their respective populations.
Notice what is missing. There is no normality assumption. There is no equal variance assumption. That freedom is why researchers reach for Mann-Whitney U when dealing with skewed reaction times, income brackets, satisfaction scores, or any measurement that refuses to behave like a textbook bell curve.
When to Use a Mann-Whitney U Test Instead of a T-Test
This is the core question, and the answer comes down to checking your data against the t-test’s assumptions. Use the Mann-Whitney U test instead of a t-test when any of the following conditions apply:
- Your data is not normally distributed and sample sizes are small (typically fewer than 30 per group). With larger samples, the Central Limit Theorem gives the t-test more breathing room.
- You have ordinal data measured on ranks or Likert scales (for example, satisfaction ratings from 1 to 5). The t-test assumes continuous measurement, which ordinal data does not provide.
- Your data contains extreme outliers. A single outlier can drag a mean far from the true center of your data. The Mann-Whitney U test, being rank-based, is barely affected by extreme values.
- Your distributions have very different shapes and you want to detect whether one group tends to produce higher values than the other without assuming equal variances.
- Your sample sizes are very small (under 10 per group), where normality testing itself becomes unreliable and parametric assumptions are hard to verify.
On the flip side, stick with the t-test when your data is approximately normal, measured on a continuous scale, and sample sizes are reasonable (30 or more per group). In that scenario, the t-test offers more statistical power, meaning it is more likely to detect a true difference when one exists.
A common question on statistics forums is what happens when both tests disagree. If your t-test returns a significant p-value but Mann-Whitney does not (or vice versa), that discrepancy is usually a signal about your data shape. A significant t-test with a non-significant Mann-Whitney often points to outliers driving the mean difference without a systematic rank shift. Trust the test whose assumptions your data actually meets.
How to Test for Normality Before Choosing
Before you decide between a t-test and Mann-Whitney U, you should check whether your data is reasonably normal. I recommend a two-step approach combining visual inspection with a formal test.
Step 1: Visual inspection. Plot a histogram and a Q-Q (quantile-quantile) plot for each group. A histogram should resemble a symmetric bell shape. A Q-Q plot should follow a relatively straight diagonal line. If your histogram looks more like a ski slope or has a long tail on one side, that is a visual red flag for non-normality.
Step 2: Formal normality test. Run the Shapiro-Wilk test, which is the most powerful normality test for small to moderate sample sizes (up to about 2,000 observations). The null hypothesis is that your data is normally distributed. A p-value below 0.05 suggests significant deviation from normality, which pushes you toward the Mann-Whitney U test.
One important caveat: with very large samples (over 500 per group), the Shapiro-Wilk test becomes overly sensitive. It will flag trivially small deviations as significant. In those cases, rely more on visual inspection and remember that the Central Limit Theorem makes the t-test robust at large sample sizes anyway.
With very small samples (under 10 per group), the opposite problem occurs. Normality tests lack the power to detect even serious violations. Here, defaulting to the Mann-Whitney U test is the safer choice unless you have strong theoretical reasons to assume normality.
T-Test vs Mann-Whitney: Key Differences
The fundamental difference between these two tests is what they compare. The t-test compares means. The Mann-Whitney U test compares mean ranks. That distinction drives every other difference between them.
Means are sensitive to every value in your dataset, including outliers. Ranks only care about relative position. If your highest value doubles from 100 to 200, the mean shifts substantially but the rank stays the same. This is why the Mann-Whitney U test is called robust against outliers.
Here is a side-by-side comparison of the key differences:
- Data type: T-test requires continuous data. Mann-Whitney U works with ordinal or continuous data.
- Distribution: T-test assumes normality. Mann-Whitney U is distribution-free.
- What it compares: T-test compares means. Mann-Whitney U compares mean ranks (stochastic dominance).
- Outlier sensitivity: T-test is highly sensitive. Mann-Whitney U is resistant.
- Statistical power: T-test has more power when assumptions are met. Mann-Whitney U loses about 5% efficiency with normal data.
- Sample size flexibility: Mann-Whitney U works better with very small samples where normality cannot be verified.
- Interpretation: T-test results are in original units (mean difference). Mann-Whitney U results are in ranks, which are less intuitive to explain.
The roughly 5% power loss I mentioned is called the asymptotic relative efficiency. When your data truly follows a normal distribution, using Mann-Whitney U instead of a t-test means you would need about 5% more data to detect the same effect. That is a small price for the safety you gain when normality is questionable.
Welch’s T-Test: The Middle Ground
Many guides skip Welch’s t-test entirely, but it deserves attention because it solves one of the most common t-test problems. The standard Student’s t-test assumes equal variances between groups. When variances are unequal, the Student’s t-test can produce inaccurate p-values. Welch’s t-test adjusts for unequal variances and is now recommended as the default independent samples t-test by many statisticians.
So where does Welch’s t-test fit in the decision tree? It handles the equal variance violation but still assumes normality. If your data is approximately normal but variances differ between groups, Welch’s t-test is the right choice over both Student’s t-test and Mann-Whitney U.
Comparing Student’s t-test to Welch’s t-test comes down to variance. Use Student’s t-test when variances are roughly equal (a ratio under 4:1 between the larger and smaller variance is a common threshold). Use Welch’s t-test when variances are clearly unequal but normality still holds. Use Mann-Whitney U when normality itself is in question.
In practice, Welch’s t-test is so robust to unequal variances that some researchers use it as their default t-test for all normally distributed data. The cost in statistical power compared to Student’s t-test when variances are actually equal is negligible.
A Simple Decision Flowchart for Test Selection
No competitor I reviewed offers a visual decision framework, so let me lay one out in text form. Follow these questions in order when you need to compare two independent groups:
Question 1: Is your data measured on at least an ordinal scale?
If no, you cannot use either test. If yes, continue.
Question 2: Are your observations independent?
If no (for example, paired or repeated measures), use a paired test instead, like the Wilcoxon signed-rank test or paired t-test. If yes, continue.
Question 3: Is your data approximately normal?
Check with histograms, Q-Q plots, and the Shapiro-Wilk test. If yes, continue. If no, skip to Question 5.
Question 4: Do both groups have similar variances?
If yes, use the Student’s t-test (maximum power). If no, use Welch’s t-test. You are done.
Question 5: Are sample sizes large enough (30+ per group) for the Central Limit Theorem to help?
If yes, the t-test may still be acceptable for mild non-normality. Consider Welch’s t-test as a compromise. If no, or non-normality is severe, use the Mann-Whitney U test.
This flowchart collapses what many guides spread across thousands of words into five decision points. Print it out and tape it next to your statistics software.
Interpreting Mann-Whitney U Results
When you run a Mann-Whitney U test, your software reports a U statistic and a p-value. The p-value tells you whether the difference between groups is statistically significant, typically using a threshold of 0.05. But interpreting the practical significance requires looking beyond the p-value.
The U statistic itself represents the number of times a value from one group exceeds a value from the other group. Most researchers focus on the p-value and the median or mean rank for each group. The mean rank tells you which group tends to score higher on average.
For effect size, the most commonly reported measure is the rank-biserial correlation, which ranges from -1 to +1. Values closer to zero indicate weaker effects. A rank-biserial correlation of 0.3 or higher generally represents a moderate effect worth paying attention to.
If your Mann-Whitney U test is not significant, several explanations are possible. The groups may genuinely not differ. Your sample size may be too small to detect a real effect (low statistical power). Or the distributions may overlap heavily despite having different shapes. Running a power analysis before your study helps distinguish between these explanations.
FAQs
When should a Mann-Whitney test be used?
Use the Mann-Whitney U test when comparing two independent groups and your data is not normally distributed, contains significant outliers, is measured on an ordinal scale, or has very small sample sizes where normality cannot be reliably assessed. It is the standard non-parametric alternative to the independent samples t-test.
When to use Welch’s t-test vs Mann-Whitney?
Use Welch’s t-test when your data is approximately normally distributed but the two groups have unequal variances. Use the Mann-Whitney U test when normality itself is violated. Welch’s t-test fixes the variance problem while keeping the normality assumption, while Mann-Whitney U abandons the normality assumption entirely.
When to use student t-test vs Welch’s t-test?
Use the Student’s t-test when both groups have approximately equal variances (variance ratio under 4:1) and data is normally distributed. Use Welch’s t-test when variances are clearly unequal. Many statisticians now recommend Welch’s t-test as the default independent samples t-test because the power cost is negligible when variances are actually equal.
Why is the Mann-Whitney U test not significant?
A non-significant Mann-Whitney U result can mean the groups genuinely do not differ, your sample size is too small to detect a real effect, or the distributions overlap heavily. If your t-test was significant but Mann-Whitney was not, the difference may be driven by outliers rather than a systematic rank shift, and the Mann-Whitney result is likely more trustworthy.
Making the Right Choice Every Time
Knowing when to use a Mann-Whitney U test instead of a t-test comes down to checking assumptions in the right order. Start with normality, then variance, then sample size. When normality fails, Mann-Whitney U is your reliable fallback. When only variance is the problem, Welch’s t-test fills the gap. When all assumptions hold, the Student’s t-test gives you maximum statistical power.
The decision framework in this guide works across every field that uses two-group comparisons, from medical research to A/B testing. Bookmark the flowchart, run the normality checks before you commit to a test, and always report which test you chose and why. Your future self, your reviewers, and your readers will thank you.