
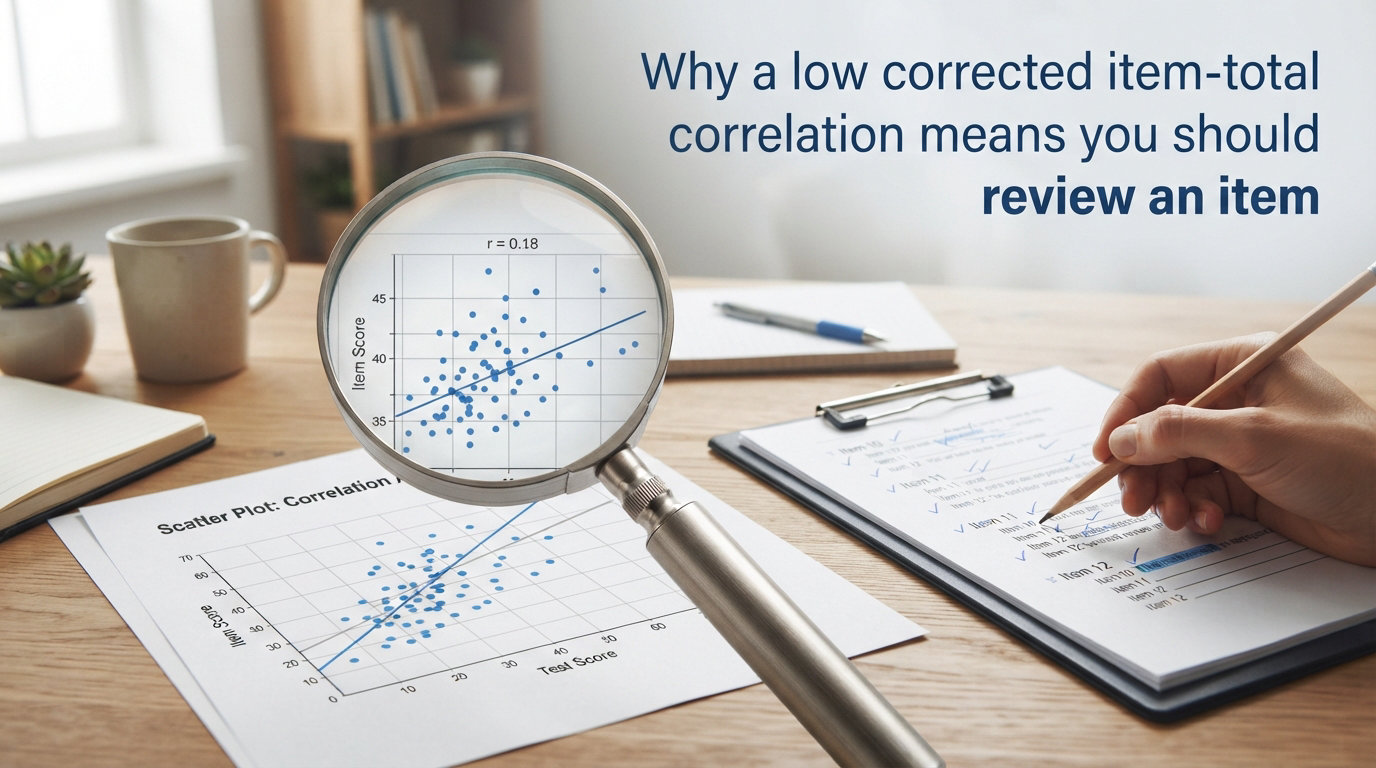
Corrected item-total correlation is one of the most useful diagnostics in psychometric measurement, and a low value tells you something specific: the item may not belong on your scale as written. When this statistic drops below commonly accepted thresholds, it signals that a single item is not aligning with the broader construct the rest of your test is measuring. The natural instinct is to delete the offending item immediately, but that response skips a step that experienced test developers consider essential. You should review the item first, because the low correlation is a symptom, and the underlying cause determines the right fix.
In this guide, we walk through what corrected item-total correlation actually measures, why low values appear, and what a proper item review involves. We also cover the threshold values most researchers use, the difference between statistical and practical significance, and how to decide between revising or removing an item. If you work in related psychometric research, scale development, educational assessment, or questionnaire construction, this framework will help you make better decisions about your instruments.
Table of Contents
What Is Corrected Item-Total Correlation?
Corrected item-total correlation (often abbreviated CITC) is the correlation between a single item’s scores and the sum of all the other items on the scale, excluding that item itself. That exclusion is the entire reason the word “corrected” appears in the name. Without the correction, you would be correlating the item with a total score that already includes the item, which inflates the correlation artificially because a variable always correlates with itself to some degree.
The correction removes this self-correlation bias. By computing the correlation between the item and the total of every other item combined, you get a cleaner measure of whether that item taps into the same underlying trait as the rest of the instrument. This matters because the whole purpose of a scale is to measure a single construct consistently across all items.
For dichotomously scored items, such as correct or incorrect answers on an ability test, the corrected item-total correlation is typically computed as a point-biserial correlation between the item and the corrected total. For polytomous items, like Likert-scale responses on a personality or attitude measure, the computation uses the Pearson correlation between the item score and the sum of the remaining items. Both approaches answer the same question: does this item move in the same direction as the overall scale?
The concept sits firmly within classical test theory, where the assumption is that each item on a well-functioning scale should reflect the same latent construct. When an item does reflect that construct, its corrected item-total correlation will be moderate to high. When it does not, the correlation drops, and that drop is the diagnostic signal that prompts a review.
Why a Low Corrected Item-Total Correlation Signals a Problem
A low corrected item-total correlation tells you that the item is not differentiating respondents the same way the rest of the scale does. People who score high on the overall instrument are not consistently scoring high on that particular item, and people who score low overall are not consistently scoring low on it either. That misalignment means the item is contributing noise rather than signal to your measurement.
This matters for two reasons. First, internal consistency reliability, most often estimated through Cronbach’s alpha, depends on the average inter-item correlation across the scale. When one item correlates poorly with the total, it drags the reliability estimate down. Removing a genuinely bad item will raise alpha. But the same statistic can also mask a second, more interesting possibility: the item may be measuring something different from the rest of the scale, which is a construct validity question, not just a reliability question.
Second, a low CITC can indicate that the item is poorly written, ambiguously worded, or measuring a different dimension entirely. In multi-dimensional questionnaires, an item that correlates poorly with one subscale total may actually correlate well with a different subscale total. That is why jumping straight to deletion can destroy useful information about the dimensionality of your instrument. The low correlation is telling you to look closer, not necessarily to cut.
Forum discussions in statistics communities reflect this confusion regularly. Researchers report borderline values like 0.298 and ask whether they should remove the item. The answer almost always depends on context: the number of items, the sample size, the dimensionality of the construct, and what the item is actually asking. A single number cannot make that decision for you.
Understanding Threshold Values: The 0.3 Rule and Beyond
The most widely cited threshold for corrected item-total correlation is 0.30, a standard popularized by Nunnally and Bernstein in their foundational psychometrics textbook. The logic is straightforward: an item should explain at least nine percent of the variance in the corrected total (since 0.30 squared equals 0.09) to justify its place on the scale. Below that level, the item is contributing too little shared variance to earn its spot without further investigation.
Most practitioners and assessment platforms use a tiered interpretation rather than a single cutoff. The following categories capture the most common consensus across psychometric literature and industry practice:
Values from 0.00 to 0.19 indicate poor discrimination. The item is not measuring the same construct as the rest of the scale, or it is so poorly written that respondents cannot answer it consistently. These items almost always require revision or removal, and the review process should focus on identifying whether the problem is wording, content, or construct mismatch.
Values from 0.20 to 0.39 indicate acceptable to good discrimination. The item is contributing to the scale, but the contribution is modest. Items in the 0.20 to 0.29 range deserve attention, especially if the overall reliability is already marginal. Items between 0.30 and 0.39 are generally retained without concern.
Values of 0.40 and above indicate very good discrimination. The item aligns strongly with the construct and is performing exactly as intended. These items are the backbone of your scale and should be preserved through any revision process.
Negative values are a special case. A negative corrected item-total correlation means the item is moving in the opposite direction from the rest of the scale, which almost always indicates a reverse-wording problem or a scoring key error. Check whether the item needs to be reverse-scored before considering any other action.
Borderline values in the 0.25 to 0.35 range generate the most debate. Our recommendation is to treat these as review triggers rather than automatic deletion triggers. If the item covers content that is theoretically important to your construct, if removing it would leave a content gap, or if the overall alpha is already acceptable, the item may be worth keeping or revising rather than discarding.
Why You Should Review, Not Automatically Delete
The strongest argument for reviewing before deleting is that a low corrected item-total correlation has multiple possible causes, and each cause calls for a different response. If you delete every item below 0.30 without diagnosis, you risk removing items that could be salvaged with a simple wording change, items that actually belong on a different subscale, and items that protect the content validity of your instrument.
One common cause of low CITC is ambiguous wording. If respondents interpret the item differently from one another, their responses will look random relative to the rest of the scale, producing a low correlation. A small rewrite can fix this without losing the content the item was designed to cover.
Another cause is extreme item difficulty or extremity bias. If an item is so easy that nearly everyone gets it right, or so hard that nearly everyone gets it wrong, it cannot discriminate between high and low scorers on the overall scale. The item may be perfectly well-written; it just needs to be calibrated to a different difficulty level or replaced with a version that better targets the ability range of your population.
A third cause is multidimensionality. If your scale is actually measuring two related but distinct constructs, items from the smaller dimension may correlate poorly with a total dominated by the larger dimension. In this case, deleting those items would strip away a meaningful part of your construct. Factor analysis can help you determine whether the low correlations are pointing to a genuine multidimensional structure that needs to be acknowledged rather than eliminated.
A fourth cause is a small or unrepresentative sample. With a small sample, individual correlations are unstable, and a low value may reflect sampling error rather than a true problem with the item. If your sample is under 100 respondents, treat all item-level statistics with caution and prioritize replication before making permanent decisions.
The risk of over-deletion is real and measurable. Each item you remove shortens your scale, and shorter scales tend to have lower reliability simply because reliability partly depends on the number of items. Removing too many items in pursuit of a cleaner correlation matrix can leave you with a scale that is too short to measure anything reliably. This is why researchers in statistics forums repeatedly warn against mechanical application of the 0.30 cutoff.
What Reviewing an Item Actually Means: A Step-by-Step Process
Reviewing an item with a low corrected item-total correlation means running through a structured diagnostic checklist before deciding on any action. The goal is to identify the cause of the low correlation so that your response matches the problem. Here is the process we recommend.
Step 1: Confirm the value is genuinely low. Re-examine your scoring syntax, check for missing data handling issues, and verify that reverse-scored items have been properly keyed. A surprising number of low CITC values turn out to be coding errors rather than genuine item problems.
Step 2: Read the item content carefully. Ask whether the wording is clear, whether it could be interpreted in multiple ways, and whether it uses vocabulary or concepts that differ noticeably from the other items. Look for double negatives, double-barreled questions, and culturally specific references that might confuse some respondents.
Step 3: Examine the item’s correlation with each subscale separately if your instrument has multiple dimensions. An item that correlates poorly with its intended subscale total but well with a different subscale total may simply be placed in the wrong location. Moving it is a better fix than deleting it.
Step 4: Check the item’s distribution. Look at the mean, standard deviation, skewness, and kurtosis. Items with severely restricted variance, floor effects, or ceiling effects will produce low correlations regardless of their quality. If the distribution is the problem, the solution is revision or replacement, not deletion of the construct area.
Step 5: Run a factor analysis or at minimum examine the item’s loading pattern. If the item loads cleanly on a factor alongside other low-CITC items, you may have discovered a meaningful dimension of your construct. If it loads weakly on all factors, the item is genuinely disconnected and is a stronger candidate for removal.
Step 6: Consider the theoretical role of the item. Even a weak item may cover an aspect of the construct that no other item addresses. If deleting it would create a content gap, prioritize revision over removal. Content validity is a judgment call that no single statistic can make for you.
Step 7: Test the impact of removal on Cronbach’s alpha. Most statistical software reports alpha-if-item-deleted alongside the corrected item-total correlations. If alpha would increase meaningfully, that supports removal. If the increase is negligible or if alpha is already in an acceptable range, retention with revision may be the better path.
Step 8: Make the decision and document it. Whether you revise, move, or delete the item, record the reasoning so that future users of the instrument understand why the change was made. Psychometric transparency matters as much as the numbers themselves.
Statistical Significance vs. Practical Significance in Item Analysis
A question that comes up frequently is whether a low corrected item-total correlation that reaches statistical significance is still a problem. The short answer is yes, it can be. With a large enough sample, even very small correlations become statistically significant. A correlation of 0.12 with a p-value below 0.05 tells you that the relationship is probably not zero, but it does not tell you that the relationship is strong enough to justify keeping the item on a working scale.
In item analysis, practical significance matters more than statistical significance. The thresholds of 0.20, 0.30, and 0.40 are about effect size, not about rejecting a null hypothesis. They reflect how much shared variance the item needs to contribute to earn its place. A large sample cannot rescue an item that contributes trivial variance to the construct, and a small sample cannot condemn an item whose true correlation is adequate but underestimated due to noise.
This is why we recommend reporting confidence intervals around your corrected item-total correlations when sample sizes are modest. A point estimate of 0.28 with a wide confidence interval might include values above 0.35, which would change your decision. Treating the point estimate as if it were the truth is a mistake that leads to unnecessary item deletion.
FAQs
What does a low item-total correlation mean?
A low item-total correlation means the item is not differentiating respondents in the same direction as the rest of the scale. People who score high overall are not consistently scoring high on that item, which suggests the item may be poorly worded, measuring a different construct, or suffering from scoring or distribution problems.
What is an acceptable corrected item-total correlation?
Values of 0.30 or above are generally considered acceptable, following the standard set by Nunnally and Bernstein. Values of 0.40 or higher indicate very good discrimination. Values between 0.20 and 0.29 are marginal and deserve review, while values below 0.20 usually indicate a serious item problem.
How do you interpret corrected item-total correlation?
Interpret the value as a measure of how well the item aligns with the construct measured by the rest of the scale. Values from 0.00 to 0.19 suggest poor discrimination, 0.20 to 0.39 suggest acceptable to good discrimination, and 0.40 and above suggest very good discrimination. Negative values usually indicate a reverse-scoring or keying error.
What does it mean when a correlation is low but significant?
A low correlation that reaches statistical significance simply means you have a large enough sample to detect that the relationship is not zero. It does not mean the relationship is strong enough for practical purposes. In item analysis, the magnitude of the correlation matters more than its p-value, so a significant correlation of 0.12 is still a review trigger.
Should I delete or revise an item with low corrected item-total correlation?
Review the item before deciding. Check for coding errors, ambiguous wording, distribution problems, and subscale misplacement. If the item covers theoretically important content, revision is usually better than deletion. Delete only when the item loads weakly across all factors, contributes no unique content, and removing it would meaningfully improve Cronbach’s alpha.
Conclusion
A low corrected item-total correlation is a diagnostic signal, not a verdict. It tells you that something about the item is misaligned with the rest of your scale, but the cause could be wording, scoring, dimensionality, sample size, or content calibration. That is why the right response is always to review the item systematically before deciding to revise, move, or delete it.
If you apply the step-by-step process outlined above, you will catch coding errors that masquerade as item problems, preserve items that protect content validity, and avoid the over-deletion trap that shortens scales and undermines reliability. The corrected item-total correlation is a tool for improving your instrument, and like any tool, it works best when paired with informed judgment rather than mechanical thresholds.