
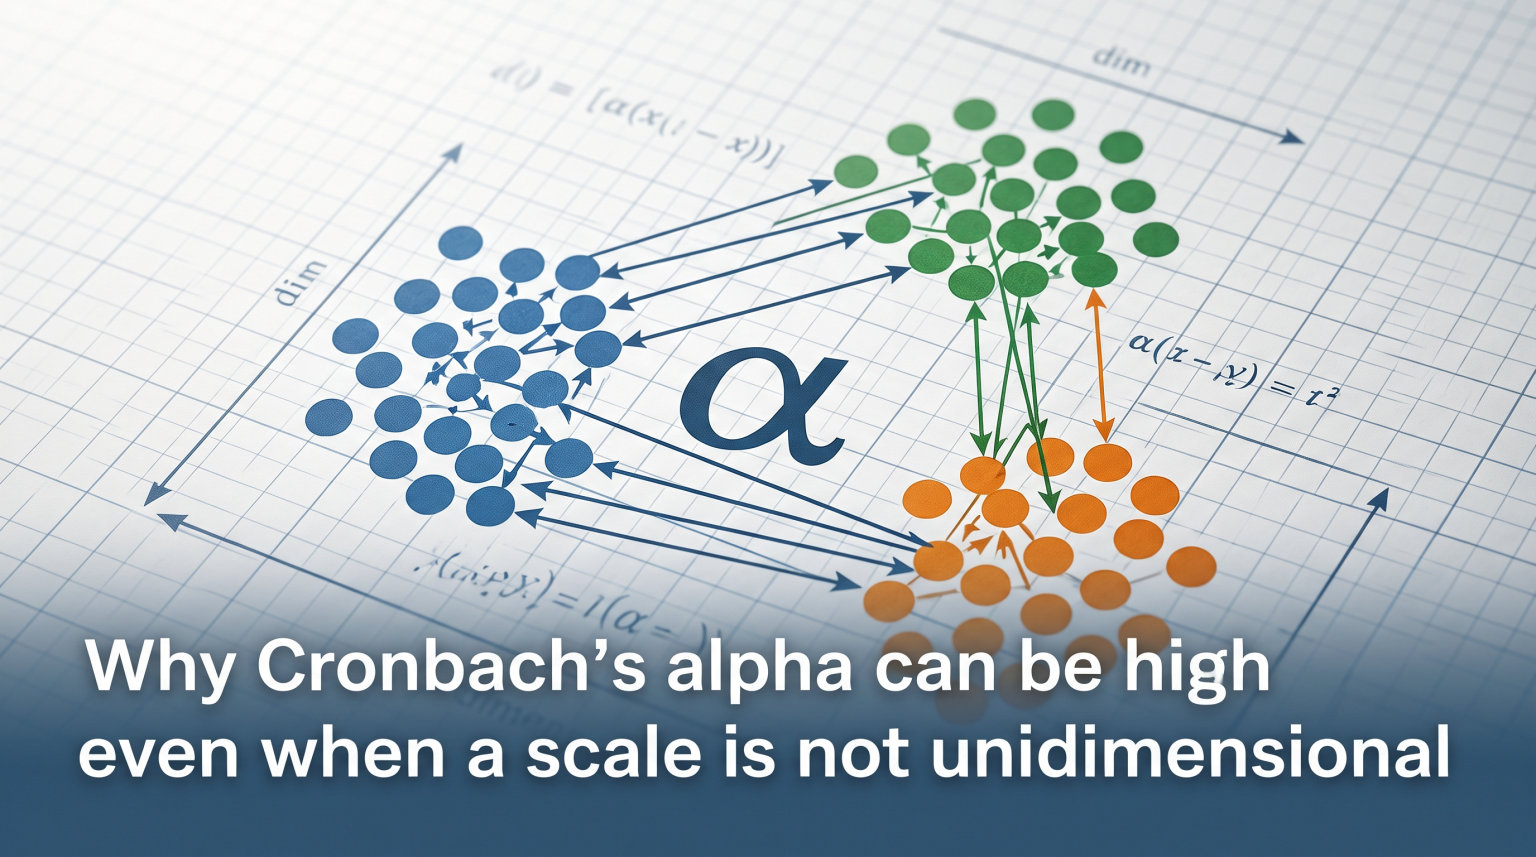
Cronbach’s alpha can be high even when a scale is not unidimensional because alpha measures internal consistency, not dimensionality. A scale with multiple underlying dimensions can still produce a high alpha coefficient when items correlate with each other and the test contains enough of them. Alpha tells you that items move together, not that they all measure one single construct.
This distinction matters because researchers routinely treat a high alpha value as proof that their scale measures one thing. That assumption leads to flawed conclusions about scale validity, misleading instrument development, and wasted research effort. The problem is so widespread that the original warnings from psychometricians have been echoed for decades, yet the misconception persists across published studies.
In this article, we explain exactly why this happens, what Cronbach’s alpha actually measures, and what you should use instead if your goal is to verify that a scale is truly unidimensional. We also walk through a practical example, a decision framework, and answers to the most common questions researchers ask about alpha and dimensionality.
Table of Contents
What Cronbach’s Alpha Actually Measures
Cronbach’s alpha is a measure of internal consistency reliability. It tells you how closely related a set of test items are as a group. When you calculate alpha, you are essentially asking whether people who score high on one item tend to score high on the others as well. The coefficient ranges from 0 to 1, with higher values indicating stronger inter-item relationships.
Lee Cronbach introduced the coefficient in 1951 as a general formula for internal consistency that worked across items with different scoring ranges. Before that, researchers relied on split-half methods that divided a test into two parts and compared scores. Alpha improved on those methods by averaging across all possible split-half combinations, producing a single number that summarized the degree to which items on a test covary with one another.
Internal Consistency vs Unidimensionality
Internal consistency and unidimensionality are not the same thing, and confusing them is the root of the problem. Internal consistency refers to how well items correlate with each other within a scale. Unidimensionality means that all items on the scale measure one and only one underlying construct.
A scale can have high internal consistency without being unidimensional. Imagine a 15-item questionnaire where 8 items measure anxiety and 7 items measure depression. Anxiety and depression are correlated constructs, so the items will tend to move together. Alpha picks up that correlation and reports a high value. But the scale is not measuring one construct. It is measuring two related but distinct ones.
The key insight is that alpha is sensitive to the average inter-item correlation and the number of items. It does not test whether those correlations arise from a single common factor or from multiple overlapping factors. That is a fundamentally different question, and it requires a different analytical approach.
Why Cronbach’s Alpha Can Be High Even When a Scale Is Not Unidimensional
There are four primary reasons why a multidimensional scale can still produce a high Cronbach’s alpha. Understanding each one will help you interpret alpha values more carefully and avoid the trap of equating reliability with dimensional purity.
Reason 1: Test Length Inflates Alpha
The formula for Cronbach’s alpha includes the number of items as a multiplier. As you add more items to a scale, alpha tends to increase even if the average inter-item correlation stays the same or even declines slightly. This means a long test with many weakly related items can produce an alpha that looks impressive on paper.
For example, a 5-item scale with an average inter-item correlation of 0.30 yields an alpha of approximately 0.68. Double the items to 10 with the same average correlation, and alpha jumps to about 0.81. Add 20 items, and alpha climbs past 0.90. None of those added items need to measure the same construct. They just need to correlate modestly with each other.
This mathematical property of the formula is why psychometricians warn against treating high alpha as evidence of anything beyond the fact that the test is long enough and the items share some variance.
Reason 2: High Inter-Item Correlation Across Dimensions
Alpha responds to the average covariance among items, not to whether those covariances come from one source. If a scale measures two or three related dimensions, the items within each dimension will correlate strongly. Items across dimensions may also correlate moderately if the dimensions themselves are related.
Think about a quality-of-life instrument that covers physical health, mental health, and social functioning. These are three distinct dimensions, but they are all aspects of overall well-being and tend to move together. A 30-item scale spanning all three could easily produce an alpha above 0.85. That number reflects the shared variance across all items, not the fact that three separate factors are at work underneath.
Reason 3: Related but Distinct Constructs
Many psychological and educational constructs overlap by nature. Anxiety and depression share substantial variance. Reading comprehension and vocabulary are tightly linked. Mathematical fluency and mathematical reasoning are correlated but separable. When you build a scale that taps several of these related constructs, the items will intercorrelate because the underlying traits themselves are connected.
Alpha treats all of this shared variance the same way. It does not distinguish between variance that comes from a single common factor and variance that comes from multiple correlated factors. The coefficient simply sums up the covariance structure and reports a reliability estimate. That estimate can be high whether the covariance matrix reflects one factor or three.
Reason 4: Violation of the Tau-Equivalent Assumption
Cronbach’s alpha assumes that all items on a scale measure the same underlying construct with equal precision. This is called the tau-equivalent model, and it requires that each item has the same true-score variance. In practice, this assumption is almost never perfectly met. Items differ in their loadings on the underlying factor, and some items are better measures of the construct than others.
When the tau-equivalent assumption is violated, alpha underestimates the true reliability of the scale. But here is the catch: even when the assumption is violated and the scale is multidimensional, alpha can still come out high. The coefficient absorbs the inter-item correlations regardless of whether they conform to a single-factor tau-equivalent model or a more complex multi-factor structure. This means alpha is neither a necessary nor a sufficient indicator of unidimensionality.
McDonald’s omega was developed partly to address this problem. Unlike alpha, omega does not assume tau-equivalence and can provide a more accurate reliability estimate when items load differently on the underlying factors.
Alpha Value Guidelines and Interpretation
Despite its limitations, Cronbach’s alpha remains the most widely reported reliability statistic in published research. The question is not whether to report it, but how to interpret it correctly. Here are the commonly accepted thresholds:
Below 0.50: Unacceptable. The items share too little variance to function as a coherent scale.
0.50 to 0.69: Questionable to acceptable. May be adequate for early-stage research but generally considered weak for established instruments.
0.70 to 0.79: Acceptable. This is the most commonly cited threshold for adequate internal consistency in social science research.
0.80 to 0.89: Good. Indicates strong inter-item relationships and is generally desirable for applied settings.
0.90 and above: Excellent or potentially redundant. Values above 0.90 may indicate that some items are essentially duplicates of each other and could be removed without losing measurement quality.
These thresholds come primarily from Nunnally’s 1978 textbook and have been widely adopted, though they were intended as rough guidelines rather than rigid cutoffs. The context of the research matters. A developing exploratory measure may be acceptable at 0.70, while a high-stakes clinical assessment instrument should aim higher.
The important point is that none of these thresholds tell you anything about dimensionality. An alpha of 0.85 means your items hang together reasonably well. It does not mean they all measure the same thing.
How to Properly Test for Unidimensionality
If Cronbach’s alpha cannot confirm that a scale is unidimensional, what should you use instead? The answer is factor analysis, combined with complementary methods that examine the dimensional structure of your items more directly.
Exploratory Factor Analysis
Exploratory factor analysis, or EFA, is the standard first step when you have no strong prior theory about how many dimensions your scale contains. EFA examines the correlation matrix among items and identifies the smallest number of factors that can account for the observed correlations.
You look at eigenvalues, scree plots, and factor loadings to determine how many factors to retain. If one factor accounts for the majority of shared variance and all items load substantially on that single factor, you have evidence of unidimensionality. If two or three factors emerge with meaningful item clusters, your scale is multidimensional regardless of what alpha says.
A common rule is to retain factors with eigenvalues greater than 1.0, though many researchers prefer parallel analysis or minimum average partial testing for more accurate factor retention decisions.
Confirmatory Factor Analysis
Confirmatory factor analysis, or CFA, takes the next step by testing a specific hypothesized factor structure against your data. If you believe your scale is unidimensional, you specify a one-factor model and evaluate how well it fits the observed covariance matrix.
Fit indices tell you whether the model is adequate. Common benchmarks include a comparative fit index (CFI) above 0.95, a root mean square error of approximation (RMSEA) below 0.06, and a standardized root mean square residual (SRMR) below 0.08. If a one-factor model fits poorly, your scale is likely multidimensional even if alpha is high.
CFA is particularly valuable because it allows you to compare competing models. You can test a one-factor model against a two-factor or three-factor alternative and see which fits the data better. This head-to-head comparison is something alpha simply cannot do.
McDonald’s Omega as an Alternative
McDonald’s omega, specifically omega-hierarchical (omega-H), offers a reliability estimate that accounts for the factor structure of the scale. While alpha assumes tau-equivalence, omega does not. It can be calculated under congeneric conditions where items have different loadings on the underlying factor.
Omega-total provides an estimate of the proportion of variance in the total score attributable to all common factors. Omega-hierarchical estimates the proportion attributable to a single general factor. If omega-H is substantially lower than omega-total, that discrepancy signals that much of the reliable variance comes from group factors rather than a single dimension. This gives you information that alpha completely misses.
Researchers increasingly recommend reporting omega alongside or instead of alpha, particularly for scales where the factor structure is complex or uncertain.
A Practical Example: Multidimensional Scale With High Alpha
Let us walk through a concrete scenario to see how this plays out. Suppose you develop a 12-item questionnaire intended to measure academic motivation. You administer it to 300 undergraduate students and calculate Cronbach’s alpha for the full scale. The result is 0.86, which looks excellent by conventional standards.
Encouraged, you conclude that the scale is reliable and unidimensional. But when you run an exploratory factor analysis, three factors emerge with eigenvalues above 1.0. Factor 1 includes items about intrinsic interest in learning. Factor 2 captures items about grade-focused extrinsic motivation. Factor 3 groups items about peer competition and social comparison.
Each subscale, scored separately, produces its own alpha: 0.82 for intrinsic motivation, 0.79 for extrinsic motivation, and 0.75 for peer competition. All three are acceptable. But the constructs are different. A student who loves learning for its own sake may have no interest in competing with classmates. The overall alpha of 0.86 obscured this dimensional structure entirely.
This is not a hypothetical scenario. It plays out regularly in published research. A mathematics teaching anxiety scale that reported high Cronbach’s alpha demonstrates how instruments in education research can achieve strong reliability coefficients while measuring a construct that spans multiple dimensions. Similarly, a self-directed learning scale development example shows how researchers work through the process of validating instruments where dimensionality requires careful factor-analytic verification beyond alpha alone.
The lesson is straightforward. Alpha is a useful starting point, but it should never be the endpoint of your dimensionality assessment. If you stop at alpha, you risk building a composite score from items that measure different things, and your findings may reflect a blend of constructs rather than a single coherent trait.
Common Mistakes When Interpreting Cronbach’s Alpha
Researchers and students make several recurring mistakes when working with alpha. Recognizing these will help you avoid them in your own work:
Treating alpha as a dimensionality test: Alpha measures internal consistency, not whether items measure one construct. This is the most common and most damaging error.
Believing higher is always better: Values above 0.95 often indicate item redundancy. Very high alpha can mean items are paraphrasing each other rather than providing independent information.
Deleting items blindly to raise alpha: Removing the item with the lowest item-total correlation will mechanically increase alpha, but it may remove meaningful variance and distort the construct you intended to measure.
Reporting only total-scale alpha: If your scale has subscales, report alpha for each subscale separately. A combined alpha across dimensions is often inflated and misleading.
Ignoring sample size effects: Alpha is sensitive to the range of individual differences in your sample. A restricted range can deflate alpha, while a diverse sample can inflate it, regardless of the true reliability of the items.
Confusing reliability with validity: A scale can be reliable (consistent) without being valid (measuring what it claims to measure). Alpha addresses consistency only.
Forum discussions on platforms like r/AskStatistics and r/AcademicPsychology reveal that confusion about these points is widespread among graduate students and early-career researchers. Many arrive at a high alpha, breathe a sigh of relief, and move on without ever examining the factor structure. The result is a body of published research where reliability is reported thoroughly but dimensionality is barely addressed.
Decision Framework: When to Trust Alpha and When to Dig Deeper
Use the following framework to decide when alpha alone is sufficient and when you need additional analyses:
Alpha may be sufficient when:
Your scale has 5 or fewer items and alpha is above 0.70.
You have a strong theoretical basis for a single construct and prior research supports it.
The scale is well-established in the literature with documented factor-analytic evidence.
You are using the scale in a context similar to its original validation study.
You need factor analysis when:
Your scale has more than 8 items, because longer scales can produce high alpha across multiple dimensions.
Alpha is above 0.90, because this may indicate item redundancy or multidimensionality masked by length.
Your items cover content that could plausibly span multiple constructs.
You are developing a new scale or adapting an existing one for a new population.
You plan to compute a single total score and interpret it as one construct.
This is not an exhaustive checklist, but it covers the most common decision points. When in doubt, running an EFA takes minutes in most statistical software and provides far more information than alpha alone. An interpersonal emotion regulation scale validation illustrates how proper psychometric procedures combine alpha with factor analysis and other evidence to build a credible case for scale quality.
FAQs
Does Cronbach’s alpha assume unidimensionality?
No. Cronbach’s alpha does not assume unidimensionality. Alpha assumes the tau-equivalent model, meaning all items measure the same construct with equal true-score variance. A scale can meet this condition across multiple correlated factors and still produce a high alpha. Unidimensionality must be tested separately using factor analysis.
Can Cronbach’s alpha be too high?
Yes. Alpha values above 0.90 often indicate item redundancy, meaning some items are so similar that they provide no additional information. Values above 0.95 should prompt a review of whether items are paraphrases of each other. A shorter scale with a slightly lower alpha may actually be a better measurement instrument.
What is the rule of thumb for Cronbach’s alpha?
The widely cited thresholds from Nunnally (1978) are: below 0.50 is unacceptable, 0.50 to 0.69 is questionable, 0.70 to 0.79 is acceptable for early research, 0.80 to 0.89 is good, and 0.90 or above is excellent but may indicate redundancy. The 0.70 threshold is the most commonly applied minimum for published research in the social sciences.
What are common mistakes using Cronbach’s alpha?
The most common mistakes are treating alpha as proof of unidimensionality, believing higher alpha always means a better scale, deleting items mechanically to raise alpha without considering construct validity, and reporting only a total-scale alpha when subscales exist. Researchers also confuse reliability with validity and ignore how sample characteristics affect alpha values.
Conclusion
Cronbach’s alpha can be high even when a scale is not unidimensional because it measures internal consistency, not dimensional structure. Test length inflates the coefficient, related dimensions produce high inter-item correlations, and the tau-equivalent assumption does not guarantee a single factor underlies the items. Alpha is a useful starting point for scale reliability, but it should never be the sole evidence for unidimensionality.
If your goal is to confirm that a scale measures one construct, use exploratory and confirmatory factor analysis. Report McDonald’s omega alongside alpha when possible. And always examine the factor structure before computing and interpreting a total score. These steps take more effort than calculating a single coefficient, but they are the only way to answer the dimensionality question that alpha was never designed to address.