
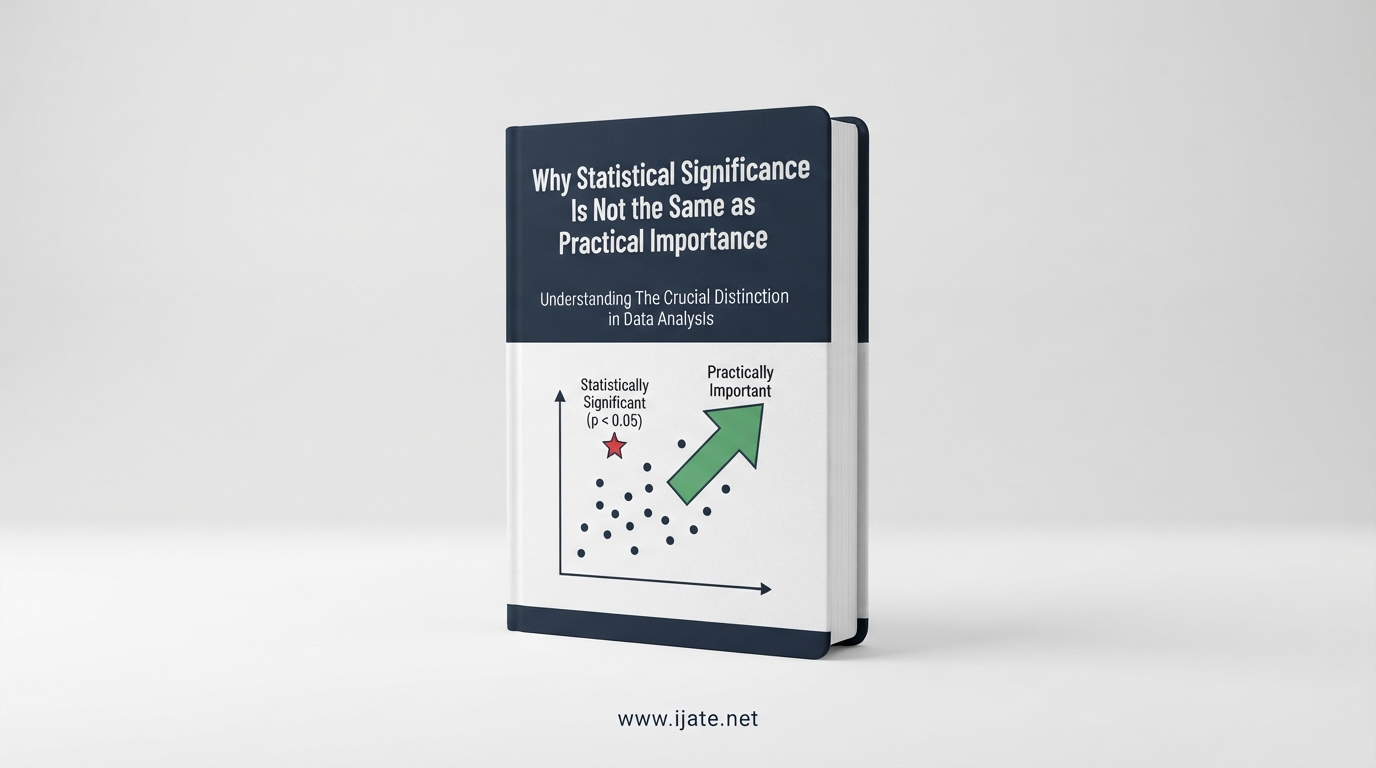
You ran an experiment. The p-value came back below 0.05. You have a statistically significant result. Time to celebrate, right? Not so fast.
Statistical significance tells you whether an effect probably exists. Practical significance tells you whether that effect actually matters. These two concepts answer fundamentally different questions, yet they get conflated constantly in research reports, business meetings, and news headlines.
Understanding statistical significance vs practical significance is one of the most important skills for anyone who works with data. Whether you are running A/B tests, reading clinical trial results, or making business decisions based on survey data, confusing these two ideas can lead you to act on trivial findings or ignore meaningful ones.
In this guide, I will walk you through what each concept means, why a result can be statistically significant but practically meaningless, how sample size warps significance, and a step-by-step framework you can use to evaluate your own results.
Table of Contents
What Is Statistical Significance?
Statistical significance is a mathematical determination that an observed effect is unlikely to have occurred by chance alone. It answers a narrow question: given the null hypothesis is true, how probable is it that we would see data at least as extreme as what we observed?
Researchers typically set a threshold called alpha, most commonly at 0.05. If the p-value from your test falls below that threshold, you reject the null hypothesis and declare the result statistically significant. The p-value measures surprise, not importance.
Here is what statistical significance does not tell you. It does not tell you the size of the effect. It does not tell you whether the effect matters in any real-world context. It does not even tell you that your hypothesis is correct. It only tells you that your data would be unusual if there were truly no effect.
This distinction matters because many people read “statistically significant” as “proven” or “important.” Neither interpretation is accurate. A statistically significant result is simply one that passes a mathematical threshold for ruling out random chance.
What Is Practical Significance?
Practical significance asks a completely different question: is this effect large enough to care about? It refers to the magnitude and real-world relevance of a finding, regardless of whether it crosses a statistical threshold.
Imagine a new medication that reduces average headache duration by 90 seconds. In a large enough clinical trial, that result could be statistically significant. But would you switch medications, pay more, or change your treatment protocol for 90 seconds of relief? Probably not. The effect is real but practically trivial.
Practical significance depends entirely on context. A 0.5% increase in conversion rate might be meaningless for a small blog but worth millions of dollars for a major e-commerce platform. A 1-point improvement on a 100-point depression scale might not matter clinically, while a 1-point improvement on a 5-point scale could be life-changing.
Unlike statistical significance, there is no universal threshold for practical significance. You must define what counts as meaningful based on costs, benefits, alternatives, and the specific domain you are working in.
Statistical Significance vs Practical Significance: The Core Difference
The core difference between statistical significance and practical significance comes down to this: statistical significance is about existence, while practical significance is about magnitude.
Statistical significance asks, “Is there something here?” Practical significance asks, “Is that something big enough to act on?” A result can answer yes to the first question while answering no to the second. This happens more often than most people realize.
Consider the four possible outcomes when you evaluate any result. A finding can be both statistically and practically significant, which is the ideal scenario. It can be statistically significant but not practically significant, meaning you detected a real but tiny effect. It can be practically significant but not statistically significant, which happens when you have a small sample and a large effect you cannot confidently rule out chance. Or it can be neither, meaning no detectable effect and no meaningful impact.
The most dangerous outcome is the second one. When a result is statistically significant but practically meaningless, people often act on it because the statistics appear to validate the finding. They implement a new feature, change a policy, or publish a paper based on an effect too small to matter in any real scenario.
Key Differences at a Glance
Statistical significance is determined by a mathematical formula involving sample size, variance, and effect size. It produces a binary outcome: significant or not significant, based on a threshold you choose ahead of time.
Practical significance is determined by domain knowledge, business context, and judgment about what magnitude of change justifies action. It produces a nuanced answer that depends on costs, benefits, and alternatives.
Statistical significance becomes easier to achieve as your sample size grows. Practical significance does not change with sample size at all. A tiny effect is a tiny effect whether you measured 100 people or 100,000.
How Sample Size Distorts Statistical Significance
Sample size is the single biggest factor that creates the gap between statistical and practical significance. With a large enough sample, almost any difference between groups becomes statistically significant, no matter how small.
Here is why this happens. The formula for standard error divides by the square root of sample size. As your sample grows, the standard error shrinks. As the standard error shrinks, smaller and smaller differences between groups become enough to reject the null hypothesis.
Imagine you are comparing two website designs. With 100 visitors per variation, you might need a 5% difference in conversion rate to reach significance. With 100,000 visitors per variation, a 0.1% difference could clear the same threshold. Both are statistically significant, but only the first represents a change most businesses would care about.
This is why large companies with massive datasets often find themselves drowning in statistically significant results that have no practical value. Every A/B test produces a significant winner. Most of those winners are too small to justify the engineering cost of implementation.
The reverse problem also exists. With a very small sample, even a large and practically meaningful effect might not reach statistical significance. A new treatment could show a 30% improvement, but if you only tested 20 patients, the confidence interval might be so wide that you cannot rule out chance. The effect is real and important, but your study was underpowered to detect it.
Effect Size: The Bridge Between Both Concepts
Effect size is the statistical measure that connects significance testing to real-world importance. While a p-value tells you whether an effect exists, effect size tells you how large that effect is.
The most common effect size measure is Cohen’s d, which expresses the difference between two group means in units of standard deviation. Jacob Cohen suggested general benchmarks for interpreting d values. A d of 0.2 is considered a small effect, 0.5 is medium, and 0.8 or above is large.
These benchmarks are starting points, not rigid rules. A small effect size might be critically important in a life-or-death medical context. A large effect size might be irrelevant if the outcome variable itself does not matter. Context always shapes interpretation.
Reporting effect sizes alongside p-values gives readers the information they need to judge practical significance for themselves. This is why most modern statistical guidelines recommend reporting both. A p-value without an effect size is like knowing a train is moving without knowing how fast or in what direction.
Other effect size measures include Pearson’s r for correlations, odds ratios for categorical outcomes, and eta-squared for ANOVA designs. Each quantifies magnitude in a way that p-values cannot.
Real-World Examples That Make the Distinction Clear
Abstract definitions only go so far. Let us look at concrete examples where the gap between statistical and practical significance caused real problems.
A/B Testing Gone Wrong
A SaaS company ran an A/B test on their pricing page with 500,000 visitors per variant. The treatment produced a statistically significant 0.08% increase in signups with a p-value of 0.03. The team celebrated and pushed the change to production.
The increase translated to roughly 4 additional customers per month. The engineering cost to maintain the new page design was higher than the revenue from those 4 customers. The result was statistically significant and practically worthless.
Clinical Trials and Patient Outcomes
A blood pressure medication trial with 12,000 patients found a statistically significant reduction of 1.2 mmHg in systolic blood pressure compared to placebo (p = 0.01). The drug was marketed as effective.
Clinicians pointed out that meaningful blood pressure reduction typically requires at least 5 mmHg to reduce cardiovascular event risk. The drug produced a real but clinically irrelevant effect. Patients were exposed to side effects for a benefit too small to improve their health outcomes.
UX Research and User Experience
A UX team tested two checkout flows. The new design reduced average completion time from 180 seconds to 178 seconds. With 8,000 participants, the result was statistically significant (p = 0.04).
No user would notice a 2-second difference in a checkout flow that already takes three minutes. The team spent six weeks building and testing a change that no human being could perceive. Statistical significance without practical judgment wasted real resources.
When Small Samples Hide Important Effects
A startup tested a radical new onboarding flow with 45 users per variation. The new flow showed a 40% increase in activation rate, but the result was not statistically significant (p = 0.12). They abandoned the project.
The effect was almost certainly real and practically enormous. But the sample was too small to rule out chance with confidence. This is the opposite mistake: ignoring a practically important result because it failed a statistical test designed for much larger samples.
How to Evaluate Practical Significance in 2026
So how do you actually determine whether a result is practically significant? There is no single formula, but a structured approach helps you make consistent, defensible decisions.
Step 1: Define the smallest effect size that matters before you run the test. What magnitude of change would justify the cost and effort of acting on this result? Write it down before data collection starts so you are not tempted to move the goalposts later.
Step 2: Calculate and report effect sizes alongside p-values. Cohen’s d, Pearson’s r, or a simple percentage difference. The specific measure depends on your data type, but the principle is the same: quantify magnitude.
Step 3: Examine confidence intervals for the effect. A confidence interval shows the range of plausible values for your effect size. If the entire interval falls below your threshold for practical importance, the result is not practically significant regardless of the p-value.
Step 4: Consider the costs and benefits of acting on the result. Implementation cost, opportunity cost, risk of unintended consequences, and potential upside all factor in. A 0.5% improvement might be worth pursuing if it costs nothing to implement and affects billions of transactions.
Step 5: Beware of p-hacking. Running many tests and only reporting significant results inflates false positive rates. Pre-register your hypotheses, correct for multiple comparisons, and report null results honestly. A result that only becomes significant after trying fifteen different analyses is not trustworthy.
Step 6: Communicate both the statistics and the practical interpretation to stakeholders. Do not just report that something was significant. Report the effect size, the confidence interval, and your judgment about whether the magnitude justifies action. Decision-makers need context, not just a p-value.
Common Misconceptions About Significance
Several misconceptions about statistical significance cause ongoing problems in research and business settings. Let me address the most damaging ones.
Misconception: A p-value tells you the probability that your result is due to chance. This is incorrect. A p-value tells you the probability of seeing data this extreme if the null hypothesis were true. It says nothing about the probability that the null hypothesis itself is true.
Misconception: Statistical significance means the result is important. As we have seen, significance only means the effect is unlikely to be zero. It says nothing about whether the effect size matters in any practical sense.
Misconception: A non-significant result means there is no effect. Absence of evidence is not evidence of absence. A non-significant result might mean the effect does not exist, or it might mean your sample was too small to detect it. This is why statistical power matters.
Misconception: The 0.05 threshold is a scientific law. It is an arbitrary convention proposed by Ronald Fisher nearly a century ago. Many fields are moving toward lower thresholds or abandoning fixed thresholds entirely in favor of reporting effect sizes and confidence intervals.
Misconception: Practical significance can be determined by a formula. Practical significance requires domain expertise, context, and judgment. No statistical calculation can tell you whether an effect matters for your specific situation.
Clinical Significance vs Statistical Significance
In medical research, the term “clinical significance” serves the same role as practical significance. A treatment can produce a statistically significant improvement in a clinical trial without producing a clinically meaningful benefit for patients.
Clinical significance is typically defined by minimal clinically important difference, or MCID. This is the smallest change in an outcome measure that patients would perceive as beneficial. Anything below the MCID is clinically irrelevant, no matter how small the p-value.
The confusion between clinical and statistical significance has real consequences. Drugs reach the market based on statistically significant trial results that offer minimal clinical benefit. Patients take medications with real side effects for improvements too small to notice. Understanding the distinction helps patients and doctors make better treatment decisions.
FAQs
Why statistical significance but not practical significance?
Statistical significance means an effect is unlikely to be due to chance, but it says nothing about the size of that effect. With a large enough sample, even tiny and meaningless differences become statistically significant. Practical significance asks whether the effect is large enough to matter in real-world decisions.
Which best illustrates the distinction between statistical significance and practical importance?
A classic example is a large clinical trial finding a new drug reduces blood pressure by 1.2 mmHg with a p-value of 0.01. The result is statistically significant because it is unlikely due to chance. But it is not practically significant because meaningful blood pressure reduction typically requires at least 5 mmHg to improve patient outcomes.
Should practical significance be determined before statistical significance is determined?
Yes. You should define the smallest effect size that matters for your specific context before collecting data. This threshold, sometimes called the minimum detectable effect, helps you design an appropriately powered study and prevents you from acting on statistically significant but practically trivial results after the fact.
Why is statistical significance not the same as clinical significance?
Statistical significance is a mathematical property of data that indicates an effect probably exists. Clinical significance refers to whether a treatment produces a benefit large enough to matter for patient care. A drug can show a statistically significant effect in a trial without offering a clinically meaningful improvement that patients would actually notice or value.
Can a result be practically significant but not statistically significant?
Yes. This happens when a study has a small sample and a large real effect. The effect may be too important to ignore, but the sample was too small to rule out chance with confidence. This is why statistical power matters and why non-significant results should not automatically be dismissed as no effect.
What is the difference between a p-value and an effect size?
A p-value tells you whether an effect is likely to exist by measuring how surprising your data would be if there were no effect. An effect size tells you how large that effect is. P-values answer the question of existence while effect sizes answer the question of magnitude.
Bringing It All Together
The distinction between statistical significance vs practical significance is not academic hair-splitting. It determines whether you make good decisions or waste resources chasing noise. Statistical significance tells you an effect exists. Practical significance tells you it matters.
Always report effect sizes alongside p-values. Define what counts as meaningful before you collect data. Question significant results with tiny effects. Take non-significant results with large effects seriously. And when you communicate findings to others, translate the statistics into real-world consequences they can evaluate.
Good data analysis is not about chasing p-values below 0.05. It is about understanding whether your results are worth acting on. That judgment requires both statistical literacy and domain expertise, working together.