
You walk out of your organic chemistry exam feeling like you just survived a car wreck. The class average was a 58. You scored a 67, and somehow that became a B+. If you have ever wondered how that transformation happened, you have already encountered grade curving in action.
Grading on a curve is a method where instructors adjust student scores after an exam or assignment based on the statistical distribution of class performance, rather than using a fixed grading scale. The goal is typically to normalize grades around a target average, usually a C or B, regardless of how difficult the exam was.
Our team spent weeks analyzing curving methods, fairness research, student experiences from forums like Reddit and Stack Exchange, and professor perspectives to put together this guide. Whether you are a student trying to understand why your 42 became a C, or an educator wondering whether curving is the right call for your class, this article breaks down exactly how curving grades works and the fairness problems that come with it.
Table of Contents
Key Takeaways: Grade Curving
- Grade curving adjusts raw scores based on class-wide performance distribution rather than a fixed percentage scale.
- Professors use multiple methods: flat scale, highest-to-100% normalization, linear scaling, bell curve, root function, and removing questions.
- Curves usually help students by raising scores, but in rare cases they can lower them.
- The biggest fairness problems include toxic competition, curve breakers, small class size distortions, and lack of transparency.
- Curved grading is largely a United States phenomenon, and many countries use criterion-referenced assessment instead.
- Alternatives like mastery-based grading and specifications grading are gaining traction as fairer approaches.
What Is Grading on a Curve?
Grade curving means taking the raw scores students earned on an exam and mathematically adjusting them to produce a new set of scaled grades. Instead of saying a 90 is an A and a 60 is an F, the professor looks at how everyone performed and adjusts the scale accordingly.
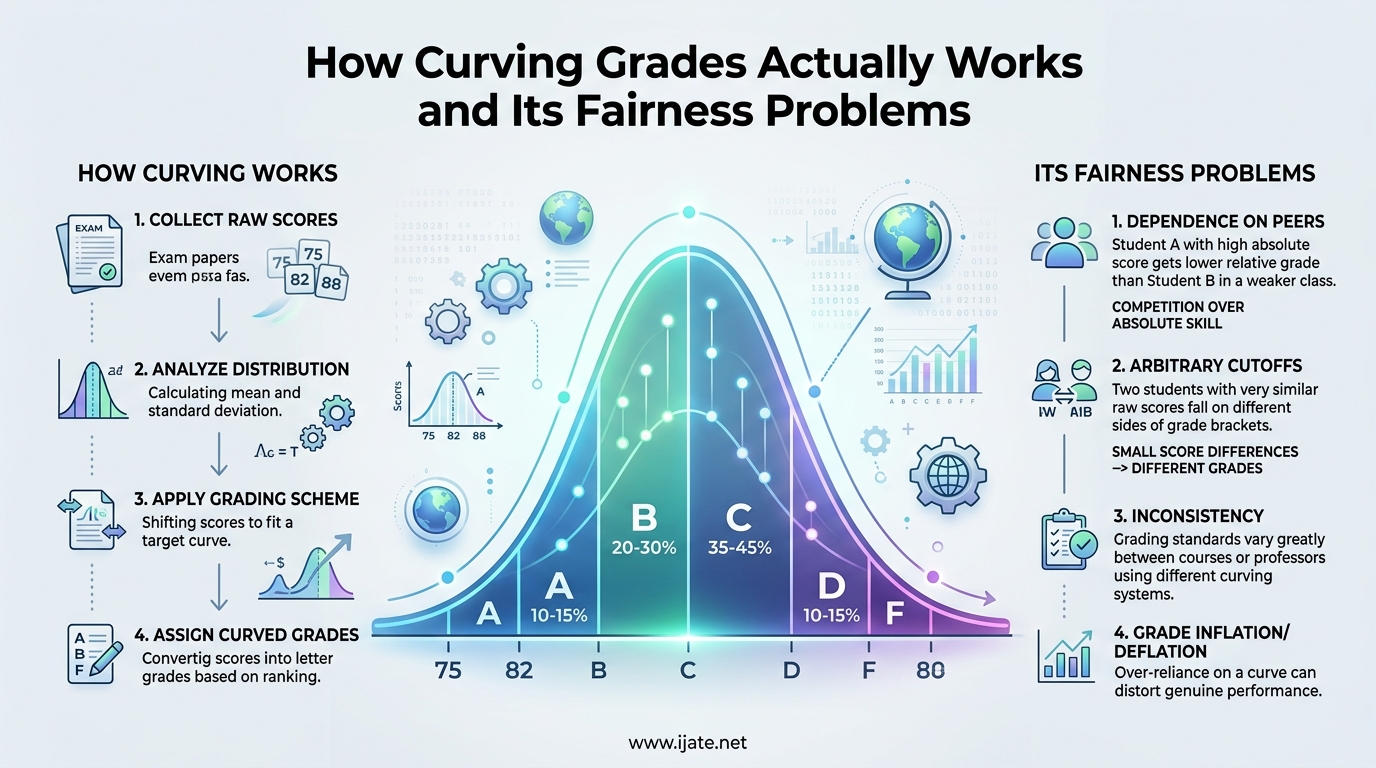
The term comes from the bell curve, also called the normal distribution. In theory, if you plot student performance on a graph, most students cluster around the middle, with fewer students at the very top and very bottom. When professors “grade on a curve,” they are trying to fit grades onto this distribution shape.
In practice, most curving is much simpler than a true statistical bell curve. Many professors just add points to every score or shift the scale so the highest score becomes 100%. The label “curving” gets applied to a wide range of adjustment methods, which is part of why the practice confuses students.
Where Did Curved Grading Come From?
No other competitor in the search results covers this, so here is the backstory. The idea of fitting grades onto a statistical distribution traces back to the early 20th century, when educational psychologists borrowed concepts from statistics and psychometrics. The goal was to make grading more scientific and consistent.
The bell curve grading model gained popularity in United States universities during the mid-1900s, particularly in large lecture courses where professors needed a way to standardize grades across hundreds of students. Law schools adopted strict curve policies in the 1960s and 1970s to control grade inflation and maintain prestige.
Before standardized testing and statistical grading, most assessment was qualitative. Professors wrote narrative evaluations or assigned pass/fail marks. The curve was introduced as a modernization, a way to turn subjective judgment into objective numbers. Whether it actually achieved that goal is one of the fairness problems we will dig into later.
Key Terms You Need to Know
Before we get into the mechanics, here are the terms that come up over and over in any discussion about curved grading:
- Raw score: The actual number of points you earned on the exam before any adjustment.
- Scaled grade: Your final grade after the curve has been applied.
- Mean: The average score across all students in the class.
- Standard deviation: A measure of how spread out the scores are. A small standard deviation means most students scored similarly. A large one means scores varied widely.
- Percentile: Your rank compared to other students. If you are in the 90th percentile, you scored higher than 90% of the class.
- Curve breaker: A student who scores so high that they prevent the rest of the class from receiving a generous curve.
- Bimodal distribution: When scores cluster around two different peaks, suggesting two distinct groups of students. This often signals a problem with the exam or the course.
How Curved Grading Actually Works
Understanding how grade curving works means following the process step by step. Here is what typically happens behind the scenes after you hand in your exam.
Step 1: The Professor Collects and Analyzes Raw Scores
After grading all exams, the professor enters raw scores into a spreadsheet or grading system. They calculate the mean, median, standard deviation, and look at the overall distribution. This tells them whether the exam functioned as intended or whether something went wrong.
For example, if the average score was a 72 with a reasonable spread, the professor might decide no curve is needed. But if the average was a 48, that signals the exam may have been too hard, poorly aligned with what was taught, or confusingly worded.
Step 2: The Professor Decides Whether to Curve
Not every exam gets curved. Professors consider several factors: Was the exam significantly harder than intended? Did most students miss the same questions, suggesting a flawed question rather than a lack of knowledge? Is the class average far below what similar courses typically see?
If the answer is yes, the professor selects a curving method. If the exam performed as expected, they may leave scores as-is, even if students are unhappy.
Step 3: The Curve Formula Is Applied
Depending on the method chosen, the professor applies a mathematical transformation to every student’s raw score. This could be as simple as adding 10 points to every score, or as complex as fitting scores onto a normal distribution with a specific mean and standard deviation.
Step 4: Scaled Grades Become Final Grades
After applying the curve, the professor reviews the scaled grades to make sure the results make sense. If the curve produces unexpected results, like a student who scored 95 receiving a lower letter grade than a student who scored 90, the professor may adjust the method or apply a floor to prevent grades from going down.
A Worked Example: Before and After a Curve
Let us say 50 students take a chemistry exam worth 100 points. The raw scores look like this: the highest score is 88, the average is 62, and the standard deviation is 14. Under a fixed grading scale, anything below a 60 is an F, meaning more than half the class fails.
The professor decides to apply a flat curve of 12 points to every score. Now the highest score becomes a perfect 100, the average becomes a 74, and students who scored a 48 now have a 60, barely passing. This is one of the simplest curving methods, and it helps every student equally in absolute terms.
But notice what happens at the top. A student who originally scored an 88 now has a 100. A student who scored a 70 now has an 82. The gap between them stayed exactly the same: 18 points. Flat curves help everyone, but they do not change the relative ranking of students. Other curve methods, like the bell curve, actually do change relative standings, which is where fairness questions get complicated.
Can a Curve Actually Lower Your Grade?
Yes, and this is one of the most misunderstood aspects of curved grading. In a strict bell curve system, grades are assigned based on percentile rank rather than absolute score. If the class performs exceptionally well and the professor is committed to a fixed grade distribution, a raw score of 85 could end up as a C if most of the class scored above 85.
This scenario is most common in law schools and certain graduate programs that enforce mandatory grade distributions. A student shared on a forum that their law school enforces a strict curve where only 10% can receive an A. That means even if you scored well objectively, your grade depends entirely on how your classmates performed.
This is also why students in heavily curved programs describe the experience as a zero-sum game. Every point your classmate gains is potentially a point you lose in relative ranking.
Common Curving Methods Explained
There is no single way to curve an exam. Professors choose from several methods, each with different effects on the grade distribution. Here are the six most common curving techniques, how they work, and their pros and cons.
1. Flat Scale Curve (Adding Points)
The professor adds the same number of points to every student’s raw score. If the highest score was an 88 and the professor wants it to be a 100, they add 12 points to every exam.
Pros: Simple, transparent, and helps every student equally. Easy for students to understand and verify.
Cons: Does not fix skewed distributions. If the exam had a bimodal distribution with one group scoring very low and another scoring high, a flat curve does not address the underlying problem.
2. Highest Score Normalization
The professor takes the highest raw score in the class and treats it as 100%. Every other score is scaled proportionally. If the highest score was 90, a student who scored 81 receives a 90% (81 divided by 90, times 100).
Pros: Ensures the top student gets a perfect score. Scales all scores up proportionally.
Cons: If one student scores unusually high, the curve becomes less generous for everyone else. This is where the concept of a curve breaker becomes relevant.
3. Linear Scale Curve
The professor uses a linear transformation formula to map raw scores onto a new range. For example, they might set it so a raw score of 40 maps to a 60 (passing) and a raw score of 90 maps to a 100. The formula fills in every score in between proportionally.
Pros: More flexible than a flat curve. The professor can control both the floor and ceiling of the adjusted scores.
Cons: Slightly more complex to calculate. Students may find it harder to understand how their grade was determined.
4. Bell Curve / Normal Distribution Grading
The professor fits all scores onto a normal distribution, typically centered around a C+ or B-. Grades are then assigned based on where each student falls relative to the mean and standard deviation. For instance, anyone within one standard deviation above the mean gets a B, anyone above two standard deviations gets an A.
Pros: Produces a predictable grade distribution that some departments require. Useful in very large classes where statistical patterns are meaningful.
Cons: Forces a distribution that may not reflect actual student learning. Creates direct competition between students. Can lower grades for strong students in high-performing classes.
5. Root Function Curve
The professor applies a mathematical root function to each score, such as taking the square root of the raw score and multiplying by 10. A raw score of 64 becomes an 80 (square root of 64 is 8, times 10 is 80). This method boosts lower scores more dramatically than higher scores.
Pros: Helps struggling students more than high performers, which can feel fairer when the exam was too hard. Compresses the range without capping the top.
Cons: May feel arbitrary to students. Can produce non-intuitive results where a few points difference in raw score leads to a large change in scaled grade.
6. Remove a Question Curve
Instead of adjusting scores mathematically, the professor identifies a question that most students missed and removes it from the scoring entirely. Everyone gets credit for that question, effectively raising all scores.
Pros: Directly addresses flawed or overly difficult questions. Feels the most transparent and fair to students because the reasoning is clear.
Cons: Only works when the problem is isolated to specific questions. Does not help when the entire exam was too hard.
Fairness Problems and Criticisms of Grade Curving
This is where the conversation gets heated. Grade curving fairness problems are the main reason the practice is controversial, and both students and professors have strong opinions. Based on our analysis of forum discussions, academic research, and educator perspectives, here are the biggest fairness issues.
Curves Create Toxic Competition Instead of Collaboration
When grades are determined by relative performance rather than absolute mastery, students are incentivized to hope their classmates do poorly. This fundamentally changes the classroom dynamic.
Multiple students on Reddit and engineering forums reported experiences where classmates refused to share study materials, sabotaged group study sessions, or actively hoped others would fail. In one widely discussed thread from a Berkeley subreddit, a student noted that curved grading in competitive STEM programs promoted inequality by turning education into a ranking exercise rather than a learning process.
This is not just anecdotal. Research on cooperative versus competitive learning environments consistently shows that competition reduces information sharing, increases anxiety, and can lower overall learning outcomes. When your grade depends on beating your peers, helping a classmate study becomes an act of self-sabotage.
Curve Breakers Generate Resentment
A curve breaker is a student who scores so high that they reduce or eliminate the curve for everyone else. In highest-score normalization, if one student scores a 98 on a brutal exam where the average was 60, that 98 becomes the new 100%. Everyone else’s curve shrinks dramatically.
Students resent curve breakers even though those students did nothing wrong. This resentment is misplaced but understandable. The system is structured so that one student’s excellence directly harms everyone else’s grade. On the AskProfessors subreddit, professors frequently discuss whether the “curve wrecker” is a real phenomenon or a myth. The consensus is that curve wreckers are real but their impact depends on the curving method used.
Small Class Sizes Make Curves Unreliable
Statistical methods like bell curve grading assume a large enough sample size for the normal distribution to hold. In a class of 200 students, the distribution of scores will likely approximate a bell curve. In a class of 15, random variation dominates.
Curving a small class can produce wildly unfair results. One student having a bad day can skew the entire distribution. A single absent student can shift the mean enough to change letter grades for everyone else. Professors on forums consistently report avoiding curves in small classes for exactly this reason.
Socioeconomic and Equity Concerns
No major competitor in the search results addresses this, so we want to highlight it. Curved grading can disproportionately harm students from disadvantaged backgrounds. Students who attended under-resourced high schools, who work full-time jobs, or who lack access to expensive test prep materials often start at a disadvantage.
In a criterion-referenced system, these students can work hard, master the material over time, and earn the same grade as anyone else. In a curved system, their grade is relative to classmates who may have had significant advantages. The curve locks in existing inequities by ranking students against each other rather than against a fixed standard.
This issue intersects with disability accommodations as well. If a student receives extra time or alternative testing conditions, their performance is then compared against peers who did not. In small classes, this can create uncomfortable dynamics and potentially violate the spirit of accommodation policies.
Psychological Impact on Student Mental Health
This is another area no competitor covers, and it matters. Curved grading has documented psychological effects on students that go beyond academic performance.
Students in heavily curved programs report significantly higher rates of anxiety, imposter syndrome, and burnout. The constant awareness that your grade depends on your peers’ performance creates a persistent stressor that criterion-referenced grading does not. You can study hard, master the material, and still receive a mediocre grade if your classmates happened to study harder.
Research on motivation also shows that relative grading undermines intrinsic motivation. When students are graded against each other, they focus on performance goals (looking smart, beating peers) rather than mastery goals (actually learning the material). This shift reduces deep learning and increases surface-level strategies like cramming and memorization.
Grade Inflation and Devalued Degrees
Here is the paradox. Critics of curved grading often worry about grade inflation, but the reality is more nuanced. When professors curve generously to avoid failing large portions of their class, grades creep upward over time. A C average in 1990 might be a B average today.
This devalues the meaning of grades. Employers and graduate programs lose the ability to distinguish between students because everyone gets a B or above. The curve, originally designed to prevent grade inflation, can actually contribute to it when used as a Band-Aid for poorly designed assessments.
On the flip side, strict curves in law schools and competitive programs can cause the opposite problem: grade deflation. Students who would earn A’s in a criterion-referenced system receive B’s or C’s simply because the curve mandates a fixed distribution.
Lack of Transparency
One of the most common complaints from students is that they do not understand how their curved grade was calculated. A student shared on a forum that their professor used an undisclosed curve formula, and students only saw their final letter grade with no explanation of the math behind it.
Students value transparency about curving policies before the exam, not after. When the syllabus states clearly whether and how grades will be curved, students can make informed decisions about how to prepare. When curving is applied retroactively and secretly, it feels arbitrary and unfair regardless of the actual mathematical method used.
Arguments in Favor of Curved Grading
To be fair, curved grading exists for a reason. It is not simply a tool professors use to torture students. Here are the legitimate arguments in favor of curving.
Correcting for Flawed or Overly Difficult Exams
Sometimes exams are just too hard. A professor writes questions they think are fair, but the class average comes in at 45%. In these cases, curving is a reasonable response. It would be unfair to fail half the class when the problem was the exam, not the students.
One law school professor shared their personal story of scoring a 14 out of 100 on their first exam. The curve brought that score into passing territory. Without the curve, they would have failed despite understanding the material well enough to practice law for decades afterward.
Maintaining Consistent Standards Across Sections
In large universities, multiple professors teach different sections of the same course. One professor writes easier exams, another writes brutally hard ones. Without a curve, students in the harder section are penalized simply because of which professor they were assigned to.
Curving normalizes across sections so that an A in section 1 roughly equals an A in section 2. This is especially important for prerequisite courses where grades affect admissions to competitive programs.
Allowing Professors to Challenge Students
If a professor knows they will curve, they can write exams that truly challenge top students without devastating everyone else. This allows for more rigorous assessment. The exam can include questions that differentiate between B students and A students without risking mass failure.
Without the safety net of a curve, professors may write easier exams to avoid failing students. This reduces the ceiling for top performers and makes it harder to distinguish exceptional work.
Law School and STEM Context
In certain fields, curved grading serves specific institutional purposes. Law schools use strict curves to maintain accreditation standards and control the signaling value of their grades. Medical school prerequisite courses use curves to manage the pipeline of applicants into competitive programs.
In these contexts, the curve is not just a grading tool. It is part of a larger system designed to rank and sort students for limited seats in professional programs.
When Curved Grading Makes Sense (and When It Does Not)
Based on our analysis of professor discussions and educational research, here is a practical framework for when curving is appropriate and when it causes more harm than good.
Curving Usually Makes Sense When:
- The exam average is far below what comparable courses typically see, suggesting the exam itself was problematic.
- Most students missed the same specific questions, indicating a flawed question rather than lack of preparation.
- The class is large enough (generally 50 or more students) for statistical methods to produce meaningful results.
- The professor needs to maintain consistency across multiple sections taught by different instructors.
- The curving method is announced in advance and applied transparently.
Curving Usually Does Not Make Sense When:
- The exam performed as expected and the class average is within a normal range. Curving in this case is just grade inflation.
- The class is small enough that individual scores swing the distribution dramatically.
- The professor curves only some students’ grades (for example, bumping borderline students up without applying the same logic to everyone).
- The curve forces a specific grade distribution that does not reflect actual student learning.
- Students were not told in advance that curving would be applied, creating a perception of arbitrariness.
Red Flags That a Curve May Be Unfair
If you are a student and you notice any of the following, the curve applied to your class may be unfair:
- The curve is applied retroactively with no syllabus policy explaining it.
- Some students’ grades went down after the curve was applied.
- The professor cannot or will not explain the curving formula.
- The curve produces a grade distribution that looks nothing like a normal bell curve (for example, mostly A’s and C’s with no B’s).
- The curve is applied differently to different sections of the same course.
Alternatives to Curved Grading
If curved grading has so many problems, what should replace it? This is an area where most competitors offer little guidance, so we want to be specific and practical. Here are four established alternatives that educators are increasingly adopting.
Mastery-Based Grading
Students must demonstrate mastery of specific learning objectives to earn a grade. There is no curve, no competition, and no limit on how many students can earn an A. If every student masters the material, every student gets an A.
Students typically get multiple attempts to demonstrate mastery, which reduces exam anxiety and encourages genuine learning. The downside is that mastery-based grading requires more work from professors to design clear rubrics and assess multiple attempts.
Specifications Grading
Each assignment is graded as either meeting or not meeting detailed specifications. Grades are determined by how many assignments students complete successfully. Students can choose their target grade by deciding how many assignments to complete at a satisfactory level.
This system combines the clarity of criterion-referenced grading with flexibility for students. It eliminates the curve entirely while maintaining academic rigor.
Contract Grading
Students sign a contract at the beginning of the term specifying what work they will complete and what grade they are working toward. If they complete the agreed-upon work at a satisfactory level, they receive the contracted grade.
Contract grading shifts the focus from ranking students to supporting their individual learning paths. It is especially popular in writing-intensive courses and humanities classes.
Criterion-Referenced Assessment
Grades reflect absolute performance against pre-defined criteria, not relative performance against classmates. A 90 is an A for everyone, regardless of how the rest of the class performed. This is the system most students assume is in place until they encounter a curve.
Criterion-referenced grading is simple, transparent, and avoids nearly all the fairness problems of curved grading. Its main weakness is that it does not account for exam difficulty. If the exam is too hard, many students fail. The solution is better exam design, not a mathematical Band-Aid.
An International Perspective on Grading
Here is something no competitor in the search results mentions. Curved grading is largely a United States phenomenon. Most other countries use criterion-referenced or absolute grading systems.
In the United Kingdom, degrees are classified based on absolute percentage thresholds. A student earning 70% or above receives a First Class Honours, regardless of how their peers performed. In Germany, grades run from 1.0 (excellent) to 5.0 (failing), and the scale is criterion-referenced.
Many international students studying in the United States find curved grading confusing and unfair because their entire educational background is built on absolute standards. When an international student scores 85% and receives a C because the class average was 88%, it feels like a betrayal of the basic contract between student and teacher.
This international perspective suggests that curved grading is a cultural choice, not a universal necessity. The United States could adopt criterion-referenced systems without sacrificing academic quality, as decades of international education demonstrate.
What Students and Educators Can Take Away
Grade curving is a tool. Like any tool, it can be used well or used poorly. When applied transparently to correct a genuinely flawed exam, it can save students from unfair failures. When used to force rankings, create competition, or mask poor assessment design, it causes real harm.
If you are a student, the most important thing you can do is ask questions before the exam. Find out whether the class will be curved, what method will be used, and how it will be applied. Knowledge is your best defense against an unfair curve.
If you are an educator, consider whether curving is truly necessary for your course. The alternatives we discussed, especially criterion-referenced grading and mastery-based assessment, address the same problems curving tries to solve without introducing toxic competition and relative ranking.
Is grading on a curve fair?
Grading on a curve can be fair when used to correct a genuinely flawed or overly difficult exam. However, it becomes unfair when it forces competition between students, penalizes strong students in high-performing classes, or is applied without transparency. The fairness of curving depends entirely on the method used, the class size, and the professor’s intent.
How to curve grades fairly?
To curve grades fairly, a professor should announce the curving policy in the syllabus before the exam, choose a method that matches the situation (such as removing a flawed question or applying a flat scale), ensure no student’s grade decreases after the curve, and explain the formula to students. Curves work best in large classes and should be avoided in small groups where results become unpredictable.
How does a curve affect grade?
A curve typically raises grades by adding points to raw scores, scaling scores proportionally, or fitting them onto a target distribution. For example, if the highest exam score was 88, a professor might add 12 points to every score so the top becomes 100. In strict bell curve systems, grades can also decrease if the class performs well overall.
How does getting graded on a curve work?
Getting graded on a curve means your final grade is determined by your performance relative to classmates rather than a fixed percentage scale. After an exam, the professor analyzes all scores and applies a mathematical adjustment. Common methods include adding flat points, scaling the highest score to 100%, or fitting scores onto a bell curve distribution.
Can curved grading lower your grade?
Yes, curved grading can lower your grade in strict bell curve systems where grades are assigned by percentile rank. If most students scored higher than you, even a strong raw score could result in a lower letter grade. This is most common in law schools and competitive graduate programs that enforce mandatory grade distributions.
What is a curve breaker in grading?
A curve breaker is a student who scores significantly higher than the rest of the class, reducing or eliminating the curve benefit for everyone else. In highest-score normalization, for example, if one student scores a 98 on a difficult exam, that score becomes the new 100% baseline, shrinking the adjustment for all other students.
Conclusion: The Future of Grade Curving
Grade curving remains one of the most debated practices in education. Understanding how curving grades actually works reveals both its legitimate uses and its significant fairness problems. The practice can rescue students from unfair exams, but it can also manufacture competition, lock in inequality, and undermine genuine learning.
The fairness problems we explored, from toxic competition to socioeconomic disparities to psychological harm, are not abstract concerns. They are documented experiences shared by real students and professors across forums, research papers, and classroom discussions.
As more educators explore alternatives like mastery-based grading and criterion-referenced assessment, the future may shift away from curved grading entirely. Until then, the best defense for students is understanding the system, asking questions early, and advocating for transparency in how grades are calculated.