
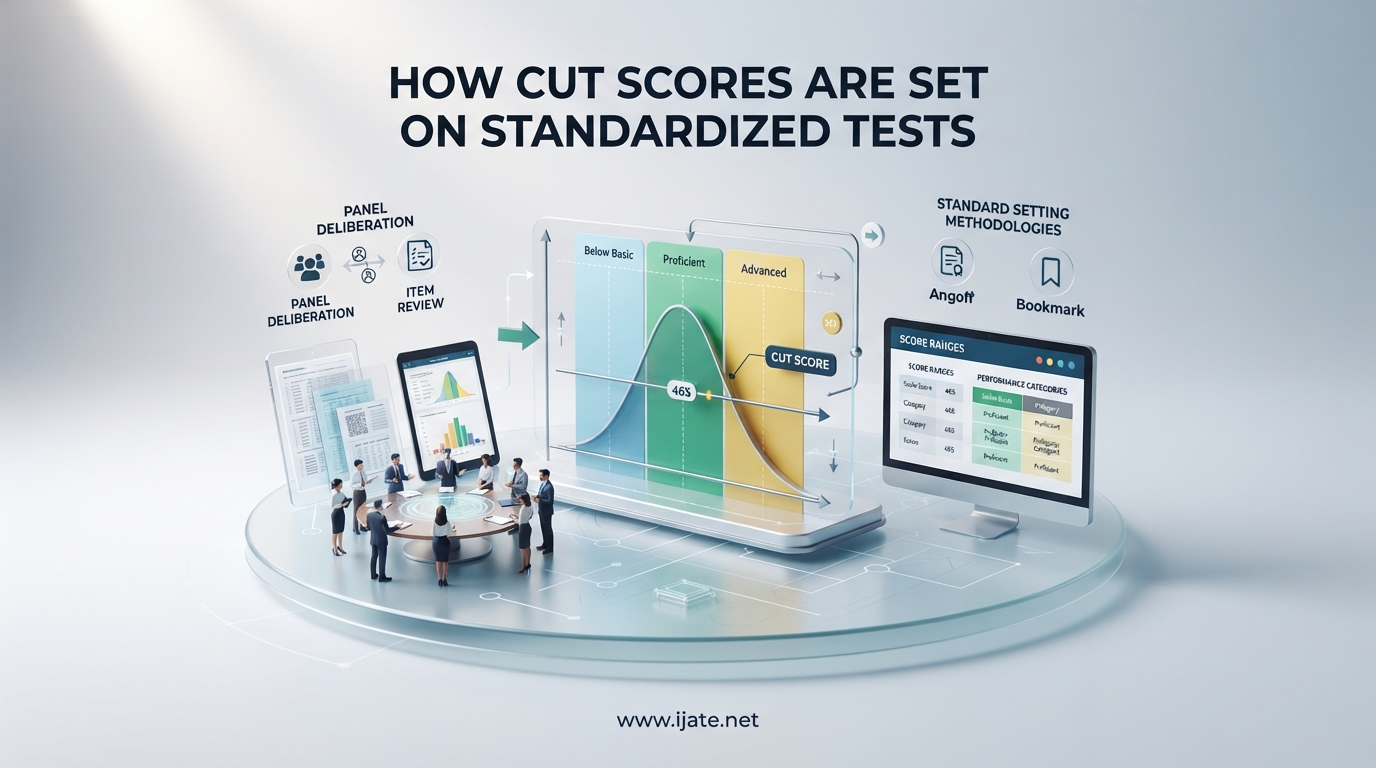
A student’s score on a standardized test rarely tells the full story on its own. What really determines the outcome is whether that score crosses a threshold — a cut score — and those thresholds are not arbitrary. Behind every passing grade, proficiency label, or scholarship qualification on a standardized test lies a rigorous, multi-step process that blends expert judgment with statistical analysis. We have spent years watching this process unfold across state departments of education, testing companies, and licensing boards, and the complexity behind a single number is remarkable. Understanding how cut scores are set on standardized tests matters whether you are an educator interpreting results, a parent trying to make sense of a report card, or a student wondering why your score earned the label it did.
Cut scores influence some of the highest-stakes decisions in education and professional licensing. They determine who graduates from high school, which teachers receive performance-based pay, how school funding gets allocated, and who is permitted to practice a profession like nursing or teaching. A single adjustment to a cut score can shift thousands of student classifications overnight. That power demands transparency, and yet the process remains poorly understood by the public. In this guide, we walk through exactly how cut scores are set on standardized tests, from the initial panel of subject matter experts to the final statistical calculations that lock in a passing point.
Table of Contents
What Is a Cut Score?
A cut score is a selected point on the score scale of a test used to classify a test-taker’s performance into categories such as pass/fail, basic, proficient, or advanced. According to ETS, a leading testing organization, cut scores are the specific points that determine whether a particular score is sufficient for a given purpose. They translate raw numbers into meaningful decisions about student learning, professional competency, or readiness for the next level of education.
The concept is distinct from a raw score. A raw score simply counts how many questions a test-taker answered correctly. A cut score translates that raw count into a judgment about what the score means. For example, answering 70 out of 100 questions correctly might produce a raw score of 70, but whether that represents proficiency depends entirely on where the cut score is set. If the cut score for proficiency is 65, the student is classified as proficient. If the cut score is set at 75, the same student falls short. The test content and the student’s knowledge have not changed — only the interpretation of the score has.
Cut scores serve different purposes across testing contexts. In K-12 state assessments, they categorize students into performance levels that guide instruction and accountability reporting. On certification exams, they determine who is licensed to enter a profession. In college admissions, cut scores on standardized tests like the SAT create eligibility thresholds for scholarships or admission. Each of these contexts requires a carefully justified cut score that reflects the actual knowledge and skills being measured.
Types of Cut Scores
Not all cut scores are established the same way. Psychometricians — specialists who apply mathematics and statistics to educational measurement — generally categorize cut scores into two fundamental types: criterion-referenced cut scores and norm-referenced cut scores. Understanding the difference between these two approaches is essential for interpreting any standardized test result.
Criterion-Referenced Cut Scores
A criterion-referenced cut score is based on what test-takers know and can do, regardless of how other test-takers perform. The standard is absolute: does this individual demonstrate sufficient mastery of the content or skill being measured? If the answer is yes, they pass or reach a particular performance level. The scores of other test-takers do not influence the classification.
Criterion-referenced tests dominate in K-12 education. State assessments in mathematics, reading, and science typically use criterion-referenced cut scores because they are designed to measure whether students have mastered specific learning standards. The Virginia Standards of Learning (SOL) tests, for example, set cut scores based on how well students demonstrate mastery of Virginia’s curriculum standards — not on how they compare to their peers. A student who answers enough questions correctly to demonstrate the required knowledge passes, period.
Certification and licensure exams almost always use criterion-referenced cut scores as well. A nursing candidate must demonstrate the minimum knowledge and skills required for safe practice. It does not matter whether other candidates perform better or worse. The cut score reflects a professional standard, not a ranking.
Norm-Referenced Cut Scores
A norm-referenced cut score, by contrast, is based on how a test-taker performs relative to a comparison group. The goal is to rank test-takers and classify them by percentile or some other relative measure. On a norm-referenced test, a student might score at the 70th percentile, meaning they performed better than 70 percent of students in the norm group. The cut score in this context divides test-takers into groups based on their relative standing.
College admissions tests like the SAT and ACT historically operated on a norm-referenced model, though their score reports now emphasize both criterion-referenced and norm-referenced interpretations. IQ tests and many gifted and talented program assessments are explicitly norm-referenced, because the goal is to identify students whose cognitive abilities stand out relative to their age group. A cut score on a norm-referenced test tells you how a student compares to others, not whether they have mastered specific content.
Many high-stakes tests use both types of cut scores. The SAT, for instance, sets benchmarks that indicate college readiness (criterion-referenced) while also reporting percentile ranks (norm-referenced). Understanding which type of cut score applies to a given test result is the first step in interpreting what that result actually means.
Methods for Setting Cut Scores
The process of determining exactly where a cut score falls on the score scale is called standard setting, and several established methods have been developed for this purpose. Each method has its own philosophy, level of complexity, and suitable use cases. The most widely used methods include the Angoff method, the Bookmark method, the Nedelsky method, the Hofstee method, the Ebel method, and the Contrasting Groups method. Psychometricians typically select a method based on the test format, the purpose of the test, and the resources available for the standard-setting study.
The Angoff Method
The Angoff method is the most widely recognized and frequently used approach for setting cut scores on criterion-referenced tests. It was introduced by William Angoff in 1971 and has become the gold standard in educational and professional certification testing. The method relies on a panel of subject matter experts who evaluate each test item individually and estimate the probability that a minimally competent test-taker would answer that item correctly.
Here is how a standard Angoff study works in practice. First, the testing organization assembles a panel of 10 to 20 subject matter experts who are familiar with the content being tested and the characteristics of the population of minimally competent test-takers. For a teacher certification exam, the panel might include practicing teachers, teacher educators, and school administrators. For a nursing licensure exam, the panel would include practicing nurses, nurse educators, and clinical supervisors.
During the first round, each panelist reviews every test item independently and provides a probability estimate for each one. The estimates are typically expressed as percentages — a panelist might judge that a minimally competent candidate has a 75 percent chance of answering a straightforward question correctly but only a 30 percent chance on a complex scenario-based item. The individual item estimates are then averaged across all panelists to produce a panel Angoff cut score for each item.
In the second round, panelists discuss their ratings as a group. They share their reasoning, challenge assumptions, and often revise their initial estimates after hearing different perspectives. This deliberative process is one of the Angoff method’s greatest strengths, because it exposes panelists to reasoning they might not have considered on their own. After discussion, panelists submit revised ratings, and a final Angoff cut score is calculated by averaging the revised estimates across all items.
The Angoff method works well for tests with multiple-choice and selected-response items because experts can evaluate the probability of a correct answer. It becomes more challenging with constructed-response items like essays or performance tasks, where panelists must judge the quality of a response rather than simply the likelihood of a correct answer. Modified versions of the Angoff method, sometimes called the Yes/No Angoff or the Bookmark method’s variant, have been developed to address these challenges.
The Bookmark Method
The Bookmark method has gained prominence in large-scale assessments, particularly K-12 state tests, because it is well-suited to tests that use item response theory for scoring. Instead of evaluating items individually, panelists are presented with an ordered booklet of test items sorted by difficulty — from easiest to hardest. Each panelist places a metaphorical bookmark at the point in the booklet where they believe a minimally competent test-taker would stop answering correctly and begin missing items.
The Bookmark method is more efficient than the Angoff method for long tests because panelists do not need to evaluate every item individually. Instead, they work through the ordered booklet and make a single placement decision. The median bookmark placement across all panelists becomes the cut score. The method is especially powerful when combined with item response theory because the IRT model provides a statistical mapping between item difficulty and the probability of a correct response.
Many state departments of education use the Bookmark method for their annual standardized assessments. The approach is considered reliable when panelists are well-trained and the ordered item booklet accurately reflects item difficulty. Because the Bookmark method produces a cut score on the IRT theta scale, the resulting cut score can be linked to any test form that has been calibrated on the same scale, making it highly practical for operational testing programs that administer multiple test forms each year.
The Nedelsky Method
The Nedelsky method, developed by Robert Nedelsky in 1954, is another expert-judgment approach that focuses on eliminating wrong answer options. For each multiple-choice item, the panel identifies the answer choices that a minimally competent test-taker could confidently eliminate. The cut score is then calculated as the proportion of items on which the minimally competent test-taker could narrow the field and make an informed guess among the remaining options.
The Nedelsky method is conceptually appealing because it directly engages experts in thinking about what knowledge distinguishes competent from incompetent test-takers. However, it is less commonly used today than the Angoff and Bookmark methods, partly because it does not translate well to constructed-response items and partly because it assumes that test-takers use a process-of-elimination strategy that may not hold true for all item formats.
Despite its limited use in modern testing programs, the Nedelsky method remains an important part of the psychometrician’s toolkit. Some studies have shown that Nedelsky ratings correlate reasonably well with Angoff ratings, and the method can serve as a useful supplement when panelists are unfamiliar with probability-based judgment tasks.
The Hofstee Method
The Hofstee method takes a different approach from the item-judgment methods described above. Instead of asking experts to evaluate individual test items, the Hofstee method asks them four broad questions about the test as a whole. Panelists are asked to consider: the percentage of test-takers who should pass, the minimum acceptable raw score, the maximum acceptable raw score, and the percentage of test-takers who should fail.
The Hofstee method is notable for being quick and easy to administer, which makes it attractive when time and resources are limited. It is also less demanding on panelists because it does not require detailed item-by-item analysis. The trade-off is that the method produces less precise cut scores than Angoff or Bookmark, and it does not engage panelists deeply with the actual content of the test. The Hofstee method is best used as a supplementary approach or as a reality check on the cut scores produced by more rigorous methods.
The Ebel Method
The Ebel method, developed by William Ebel, combines content relevance ratings with difficulty judgments. Panelists first classify each test item into content categories and rate its relevance to the test purpose. They then estimate the proportion of items within each relevance-difficulty combination that a minimally competent test-taker would answer correctly. The cut score is calculated by summing the expected number of correct answers across all content-difficulty categories.
The Ebel method is conceptually similar to the Angoff method but uses a content-relevance framework that can be particularly useful when a test covers a broad range of content areas. It requires panelists to think systematically about both what is being tested and how difficult each item is, producing a cut score grounded in content validity as well as item difficulty. The method has been used in licensure and certification testing, though it demands more time and expertise from panelists than simpler approaches like the Hofstee method.
Contrasting Groups Method
The Contrasting Groups method is a data-driven alternative to expert-judgment methods. Instead of asking panelists to estimate probabilities or make judgments about item difficulty, the Contrasting Groups method uses actual test performance data. Test-takers are classified into groups based on an external criterion that indicates their true level of competence — for example, experienced teachers versus novice teachers, or practicing nurses versus nursing students. The cut score is then set at the point on the score distribution that best separates the groups.
The Contrasting Groups method has the advantage of being based on real performance rather than expert opinion, which can make it more defensible in some contexts. It works best when a clear external criterion is available to classify test-takers into competent and not-yet-competent groups. The method is less useful when no reliable external criterion exists, which is often the case for new tests or tests covering content for which no independent measure of competence is available. Many testing programs combine the Contrasting Groups method with expert-judgment methods, using the expert panel to set the cut score and the Contrasting Groups data to validate it.
Method Comparison
Each method has strengths and limitations that make it more or less appropriate for a given testing context. The Angoff method is the most widely validated and accepted for criterion-referenced tests, but it demands significant time and expertise from panelists. The Bookmark method is more efficient for large tests using IRT, but it requires a properly calibrated item pool. The Contrasting Groups method provides empirical validation but depends on having a reliable external criterion. The Hofstee method is quick and easy, but less precise. The Nedelsky and Ebel methods offer useful alternatives for specific situations.
In practice, many testing organizations use multiple methods simultaneously, applying at least two different approaches and checking whether they converge on a similar cut score. When different methods produce similar results, confidence in the cut score increases. When they diverge, the discrepancy signals that further deliberation and analysis are needed before finalizing the standard.
The Standard-Setting Process
Setting a cut score is rarely a single event. It is a structured process that typically unfolds across several stages, each designed to bring rigor, transparency, and defensibility to the final decision. The process begins long before the panel convenes and continues after the cut score is published.
Assembling the Expert Panel
The first and arguably most important step is selecting the right panel of subject matter experts. Panelists must understand the content being tested, be familiar with the population of test-takers, and represent the diversity of perspectives that the testing field demands. For a state K-12 assessment, the panel typically includes classroom teachers, curriculum specialists, and education professors. For a professional certification exam, it includes licensed practitioners, educators, and sometimes members of the public who have a stake in the credential being awarded.
The size of the panel varies by test and organization, but most standard-setting studies involve between 10 and 25 panelists. Smaller panels risk having the cut score unduly influenced by one or two strong personalities. Larger panels become logistically unwieldy and may not allow for meaningful deliberation. The psychometrician running the study must balance these considerations and ensure that the panel is demographically and geographically representative of the population that the test serves.
Panelists receive training before the study begins. They learn about the purpose of the test, the characteristics of the population being tested, and the definition of the minimally competent test-taker that they will use as their reference point throughout the process. This training is essential because inconsistent understanding of the standard-setting task is one of the most common sources of unreliability in cut score studies.
Item Review and Discussion
Once the panel is assembled and trained, panelists begin reviewing test items. The review process varies by method but generally involves individual judgments followed by group discussion. In an Angoff study, panelists rate each item independently in Round 1. They then discuss their ratings as a group, sharing the reasoning behind their estimates and questioning assumptions that differ markedly from the group average.
Research on standard-setting panels consistently shows that group discussion improves the quality of cut score judgments. Panelists learn from each other, correct misunderstandings, and develop a shared understanding of what minimally competent means in the context of the specific test. The deliberative process is one reason why the Angoff method remains the preferred approach for many high-stakes testing programs despite being more time-intensive than simpler alternatives.
After discussion, panelists submit revised ratings in Round 2. The shift between Round 1 and Round 2 ratings is called the shift effect, and it is a normal and expected part of the process. Large shifts may indicate that panelists entered the study with inconsistent assumptions, while small shifts suggest that the initial training and orientation were effective.
Calculating and Validating the Cut Score
Once the panel has completed its deliberations, the psychometrician calculates the cut score using the agreed-upon formula. For an Angoff study, this typically involves averaging the Round 2 item ratings across all panelists to produce a total test cut score. The psychometrician may also apply adjustments for guessing, measurement error, and other factors depending on the test format and the specific requirements of the testing program.
Before the cut score is finalized, the testing organization typically conducts a validation study. This might involve comparing the cut score to actual performance data using the Contrasting Groups method or examining the classification accuracy of the cut score. The goal is to ensure that the cut score correctly classifies test-takers into the appropriate performance categories.
The entire standard-setting process, from panel assembly to final cut score publication, typically takes two to four months for a large-scale assessment. The resulting cut score report documents the methodology, the panel composition, the item ratings, and the final cut score, providing transparency and a defensible audit trail for stakeholders.
Researchers at testing organizations like ETS have documented the standard-setting process extensively. Their work has shown that well-conducted standard-setting studies produce reliable and valid cut scores that serve the needs of test-takers and decision-makers alike. The integration of expert judgment with statistical rigor is what separates a defensible cut score from an arbitrary one.
Scaled Scoring and Equating
Raw scores are rarely what test-takers see on their score reports. Before reaching the test-taker, a raw score is typically converted to a scaled score through a process called scaling. Scaling serves several important purposes. It adjusts for differences in test difficulty across different test forms, ensures that scores are comparable across administrations, and produces a score scale that is interpretable and meaningful to stakeholders.
Test equating is the statistical procedure that makes scaled scores comparable across different forms of a test. If one group of test-takers takes a slightly harder version of the SAT and another group takes an easier version, equating adjusts the raw score-to-scaled score conversion so that a scaled score of 600 means the same thing on both forms. Without equating, a student taking the harder form would need a higher raw score to earn the same scaled score, creating an unfair disadvantage.
Equating is closely tied to how cut scores are set on standardized tests. Most testing programs set their cut scores on the scaled score scale, not the raw score scale. This means that the cut score is fixed in terms of the knowledge and skills it represents, regardless of which test form a student happens to receive. When equating is done correctly, a student who knows the material should pass no matter which form they take.
The standard error of measurement adds another layer of complexity. No test is perfectly reliable, and a student’s observed score on any given administration may differ from their true ability level due to factors like test anxiety, fatigue, or random guessing. Psychometricians account for this uncertainty when setting cut scores, often setting the cut score slightly above the minimally competent level to ensure that students who are truly competent are not misclassified due to measurement error.
Performance Levels and Achievement Classifications
Most standardized tests do not use a single cut score. Instead, they use multiple cut scores to create a range of performance levels. The most common framework in K-12 education uses three levels: basic, proficient, and advanced. Some tests add a fourth level, below basic, to identify students who are significantly behind grade level. The National Assessment of Educational Progress (NAEP) uses four achievement levels — below basic, basic, proficient, and advanced — and sets separate cut scores for each boundary.
Performance level descriptors explain what it means to perform at each level. A proficient descriptor might read, “Students performing at the Proficient level demonstrate competency over challenging subject matter, including subject matter knowledge, application of such knowledge to real-world situations, and analytical skills appropriate to the subject area.” These descriptors help educators, parents, and students understand what the cut scores represent in concrete terms.
Developing performance level descriptors is a collaborative process that typically involves the same expert panel responsible for setting the cut scores. Panelists draft, discuss, and refine the descriptors to ensure they accurately describe the knowledge and skills associated with each performance level. Well-written descriptors make test results more actionable because they connect the numerical score to concrete expectations about student learning.
Controversies and Real-World Considerations
Cut scores are not set in a vacuum. They exist within policy environments that exert real pressure on the standard-setting process, and the consequences of cut score decisions ripple through communities in ways that testing organizations cannot always control. Understanding how cut scores are set on standardized tests requires looking beyond the technical methodology to the political and social context in which these decisions are made.
One of the most persistent concerns is that cut scores are manipulated to produce politically desirable outcomes. A state that wants to show improvement in student achievement can lower its cut scores, making it appear that more students are reaching proficiency even if actual student performance has not improved. This phenomenon, sometimes called score inflation, has been documented in multiple states. In Illinois, for example, the math cut score on the PARCC assessment dropped from 68 percent to 64 percent between 2018 and 2022 while the state simultaneously reported rising proficiency rates. Critics argued that the cut score change, not improved student learning, drove the apparent gains.
Virginia faced the opposite problem. When the state raised its cut scores in the 2010s to align with more rigorous national expectations, pass rates on the SOL tests dropped sharply. Schools that had been rated as fully accredited suddenly fell below the threshold, triggering interventions and public criticism. The experience illustrated how cut score changes can reshape educational outcomes overnight, even when the underlying test has not changed.
Transparency is widely recognized as the best antidote to public skepticism about cut scores. When testing organizations publish detailed standard-setting reports, share the composition of their expert panels, and explain the methodology they used, stakeholders are better equipped to evaluate the legitimacy of cut score decisions. The ETS primer on setting cut scores, the Virginia DOE cut score documentation, and the published reports from large-scale assessment programs all serve this transparency function. Researchers have also explored assessment in education from a parent perspective, providing additional context on how families interpret standardized test results.
There is also an ongoing debate about whether cut scores should be lowered to help students who are struggling. Proponents of lowering cut scores argue that high failure rates demoralize students and that standards should reflect realistic expectations for the population being tested. Opponents argue that lowering standards does a disservice to students by masking learning gaps and delaying needed interventions. The statistical methods in scoring that underpin cut score setting are designed to be objective, but the ultimate decision about where a cut score falls inevitably involves value judgments about what level of performance is acceptable.
Forum discussions among educators, students, and parents reveal deep frustration with the opacity of the cut score process. Many people feel that cut scores are set behind closed doors by unnamed experts using methods they cannot evaluate. Others worry that cut scores change from year to year in ways that seem designed to serve political rather than educational purposes. Addressing these concerns requires more than good technical methodology — it requires genuine engagement with the communities affected by cut score decisions and a commitment to explaining the process in language that non-specialists can understand.
Frequently Asked Questions
What is a cut score in standardized testing?
A cut score is a selected point on the score scale of a test used to classify a test-taker performance into categories such as pass/fail, basic, proficient, or advanced. It determines whether a score is sufficient for a specific purpose, such as demonstrating mastery of grade-level content or qualifying for professional certification. Cut scores are established through a process called standard setting, which involves expert judgment and statistical analysis.
What are the methods of setting cut scores?
The main methods for setting cut scores include the Angoff method, where experts estimate the probability that a minimally competent test-taker will answer each item correctly; the Bookmark method, where panelists place a bookmark in an ordered item booklet at the point where competence ends; the Nedelsky method, which identifies wrong answers that competent test-takers can eliminate; the Hofstee method, which asks panelists four broad judgment questions; and the Contrasting Groups method, which uses actual performance data to find the score that best separates competent from non-competent test-takers.
What is a 63% on a test?
A score of 63 percent on a test means the test-taker answered roughly 63 percent of items correctly. Whether this is a passing score depends entirely on where the cut score is set. On some tests, 63 percent might exceed the cut score for proficiency. On others, it might fall below the minimum passing threshold. The cut score converts a raw percentage into a meaningful classification, and the same raw score can mean very different things on different tests or in different testing contexts.
Who sets cut scores on standardized tests?
Cut scores are set by panels of subject matter experts assembled by the testing organization. These panels typically include educators, subject-area specialists, and sometimes members of the public. The panel is guided by a psychometrician who designs the standard-setting study, trains the panelists, and calculates the final cut score. In K-12 education, state departments of education convene these panels. For professional certification exams, the testing company works with a committee of licensed practitioners and educators in the relevant field.
Why do cut scores change on standardized tests?
Cut scores can change for several reasons. Test content and difficulty may shift when a new version of a test is introduced. Learning standards that the test measures may be updated by policymakers. Testing organizations may refine their standard-setting methodology based on new research. And in some cases, political or policy pressures may lead to intentional adjustments. When cut scores change, the goal is usually to ensure that the standard accurately reflects the level of knowledge and skill that test-takers should demonstrate. However, changes should always be accompanied by clear documentation and public explanation to maintain trust in the testing process.
Conclusion
Understanding how cut scores are set on standardized tests reveals that the numbers on a score report are the product of a careful, deliberate process. Expert panels evaluate test items, psychometricians apply statistical methods, and testing organizations validate the results before a single cut score is published. The methods involved — from the Angoff method to the Bookmark method to the Contrasting Groups method — each bring a different kind of rigor to the task of translating raw performance into meaningful educational decisions.
For educators interpreting test results, the key takeaway is that a cut score represents a professional judgment about what level of performance is acceptable, not an inherent property of the test itself. For parents and students, understanding the standard-setting process provides context for why scores matter and how they are interpreted. For policymakers, the lesson is that cut score decisions deserve transparency, documentation, and public accountability.
The next time you see a standardized test score report, remember the panel of experts behind it, the hours of deliberation, and the statistical care that went into setting the threshold between one performance level and the next. Cut scores shape educational opportunity and professional qualification. Knowing how they are set on standardized tests is the first step toward making sure they serve all test-takers fairly.