
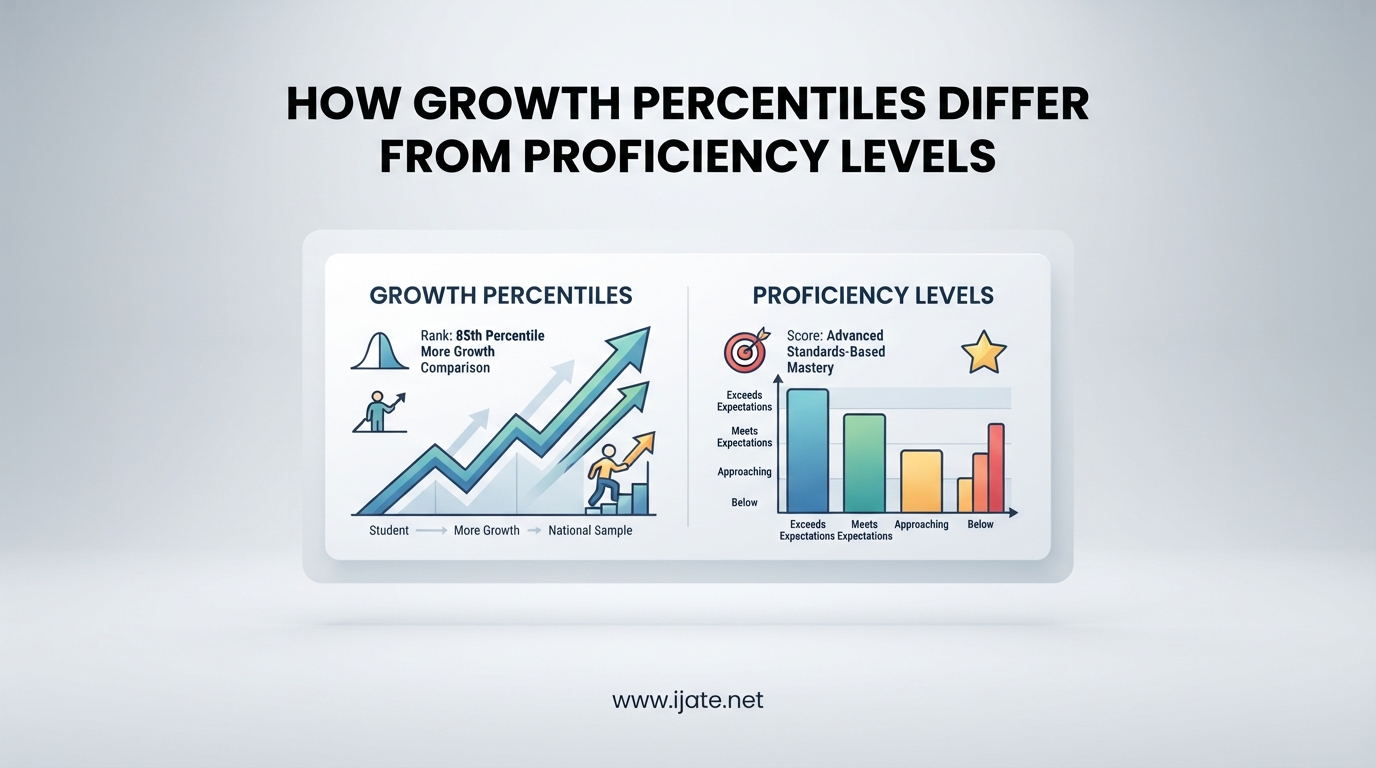
Imagine two students running a race. One crosses the finish line; the other started a mile behind and shaved ten minutes off their personal best. Proficiency tells you who finished. Growth percentiles tell you who improved the most along the way. That distinction matters enormously in education, where a single test score can either hide remarkable progress or mask serious gaps.
Understanding how growth percentiles differ from proficiency levels helps parents, teachers, and administrators make better decisions about students. Proficiency measures whether a student has reached a specific bar set by grade-level standards. Growth percentiles measure how much that student learned over time compared to their academic peers. Both metrics answer different questions, and neither one tells the whole story alone.
In this guide, I will break down what each metric means, how they are calculated, and why schools increasingly rely on both for accountability under ESSA. I will also walk through a practical example so you can read your child’s next test score report with confidence.
Table of Contents
What Is Proficiency?
Proficiency measures whether a student has demonstrated enough content mastery to meet grade-level standards at a specific point in time. It is a snapshot, not a trend line. When a state test labels a student “proficient,” that label says the student cleared a predetermined bar on that particular summative assessment.
Think of proficiency as the destination. Every state sets its own proficiency standards based on what students should know and be able to do at each grade. These standards get translated into achievement levels that appear on score reports.
Most states use four levels of proficiency on their standardized tests:
- Advanced: The student exceeds grade-level expectations and shows deep content mastery.
- Proficient: The student meets grade-level expectations and is on track for the next grade.
- Basic: The student approaches grade-level expectations but has gaps that need attention.
- Below Basic: The student falls significantly short of grade-level expectations and needs intervention.
Proficiency is criterion-referenced, meaning each student is measured against a fixed standard, not against other students. A student either meets the bar or they do not, regardless of where they started. This makes proficiency a powerful tool for identifying which students need support, but it cannot tell you how far a student has traveled to get there.
One frustration parents often raise on forums like r/specialed is that good classroom grades do not always translate into proficiency on state tests. One teacher noted that roughly three-quarters of students earned an A, B, or C in class, yet only 20 percent demonstrated proficiency on the state assessment. That disconnect happens because classroom grades reward effort and completion, while proficiency tests measure specific standards mastery.
What Are Student Growth Percentiles?
Student growth percentiles, or SGPs, measure how much a student learned over time compared to other students who started with similar prior test scores. While proficiency is a snapshot, growth percentiles capture the journey. They answer a different question: not “Did this student reach the bar?” but “How fast did this student grow compared to their academic peers?”
Here is where the term “academic peers” becomes important. Academic peers are students across the state who scored similarly on past tests. If your child scored a 240 on last year’s math assessment, their academic peer group includes every other student who also scored near 240. The growth model then compares how your child performed this year against that peer group.
A student growth percentile of 75 means the student grew faster than 75 percent of their academic peers. An SGP of 50 represents median growth, exactly average for that peer group. An SGP of 35 means the student grew faster than only 35 percent of peers, suggesting slower-than-typical progress.
Growth percentiles are norm-referenced. They compare students to each other rather than to a fixed standard. This creates a different kind of insight. A student who started far below grade level but made enormous progress could earn a high SGP even if they have not yet reached proficiency. Conversely, a student who started well above grade level and coasted might show a low SGP despite remaining proficient.
Here is a practical example. Imagine two fifth graders take the state math test. Student A scored 200 last year and 230 this year. Student B scored 280 last year and 290 this year. Student B ends up with a higher overall score and likely remains proficient. But Student A grew ten points more relative to their academic peers, which means Student A could have a higher SGP. Proficiency rewards Student B for where they landed. Growth percentiles reward Student A for how far they traveled.
How Growth Percentiles Differ From Proficiency Levels
The core difference between proficiency and growth percentiles comes down to destination versus journey. Proficiency asks whether a student arrived at grade-level expectations. Growth percentiles ask how much progress the student made compared to peers with similar starting points.
The table below summarizes the key differences at a glance:
- Question answered: Proficiency asks “Did the student meet the standard?” Growth asks “How much did the student improve?”
- Reference point: Proficiency is criterion-referenced against fixed standards. Growth is norm-referenced against academic peers.
- Time frame: Proficiency measures achievement at one point in time. Growth measures change across two or more testing periods.
- Starting point: Proficiency ignores where a student began. Growth percentiles depend entirely on prior performance.
- What it rewards: Proficiency rewards reaching a benchmark. Growth rewards progress regardless of the starting line.
- Typical scale: Proficiency uses four achievement categories. Growth uses a 1-to-99 percentile scale.
A common point of confusion is what happens when the two metrics disagree. A student can show high growth but low proficiency, meaning they are catching up fast but have not yet reached grade level. Another student can be proficient but show low growth, meaning they maintained their position but did not advance much. Both scenarios tell educators something important that neither metric alone would reveal.
This is exactly why I recommend never looking at just one number. A proficiency score tells you where the student stands today. A growth percentile tells you whether the student is heading in the right direction. Together they paint a far more complete picture of learning.
How Schools Use Both Metrics Together
Under the Every Student Succeeds Act, states must include both proficiency and growth in their accountability systems. ESSA replaced No Child Left Behind, which focused almost exclusively on proficiency and famously left schools scrambling when students who started far behind could never close the gap fast enough to meet annual proficiency targets.
By requiring growth measures alongside proficiency, ESSA acknowledged that schools serving high-needs populations deserve credit for progress, not just final outcomes. A school where most students enter below grade level can demonstrate strong growth even if proficiency rates remain low. That growth data can qualify the school for recognition or additional support resources.
Teachers and intervention teams use both metrics to make decisions about which students need help and what kind. A student with low proficiency and high growth is trending in the right direction and may just need more time. A student with low proficiency and low growth needs immediate, targeted intervention. A student with high proficiency and low growth might need enrichment to stay engaged.
Growth percentiles also factor into teacher evaluation in some states, though this practice draws significant criticism. Teacher effectiveness depends on many factors beyond a single year of test scores, and tying evaluations to SGPs can penalize educators who work with the most challenging populations.
For parents, the practical takeaway is simple. When you receive your child’s test score report, look for both the proficiency level and the growth percentile. If your child is below proficient but showing high growth, ask the teacher what supports are in place to maintain that momentum. If your child is proficient but growth has stalled, ask whether the curriculum is challenging enough. Both conversations matter.
Limitations and Criticisms of Growth Percentiles
Growth percentiles are not without controversy. Professor Stephen Sireci of UMass Amherst has pointed out that student growth percentiles have yet to be fully supported by research in terms of their reliability for high-stakes decisions. The models rely on statistical assumptions that do not always hold up cleanly in real-world data.
Measurement error is another concern. Every test score carries a margin of error, and when growth models subtract one noisy score from another, that error compounds. A student’s SGP can swing significantly from year to year based on factors having nothing to do with learning, such as a bad test day or a disrupted school year.
Some educators argue that proficiency must remain the ultimate goal. As one special education teacher on Reddit put it, growth versus proficiency is a real conversation, but in the end proficiency needs to be the final destination. Growth matters because it tells us whether a student is on track to reach that destination, but it can never fully replace the question of whether students have actually learned what they need to know.
I share this view. Growth percentiles are valuable for understanding trajectory and for giving credit to students and schools working hard to close gaps. But they work best as a complement to proficiency, never as a replacement.
FAQs
What is the difference between proficiency and growth?
Proficiency measures whether a student has met grade-level standards at a single point in time, like a snapshot. Growth percentiles measure how much a student has learned over time compared to their academic peers, like a trend line. Proficiency is the destination; growth is the journey.
How to interpret growth percentiles?
Growth percentiles range from 1 to 99. An SGP of 50 means the student grew at a typical rate compared to academic peers. Above 50 indicates above-typical growth, and below 50 suggests slower-than-typical progress. Most states consider an SGP of 35 or lower as a signal that a student may need additional support.
What is a good student growth percentile?
A student growth percentile of 50 represents median growth, meaning the student progressed at a typical rate compared to peers. SGPs above 50 indicate stronger-than-typical growth, with 65 or higher generally considered strong. Anything consistently below 35 warrants attention from teachers and parents.
What are the 4 levels of proficiency?
Most states use four achievement levels on standardized tests: Advanced (exceeds grade-level expectations), Proficient (meets grade-level expectations), Basic (approaches grade-level expectations), and Below Basic (falls significantly short of grade-level expectations). Each level is tied to specific performance standards set by the state.
What does academic peers mean in education?
Academic peers are students statewide who scored similarly on prior tests. For example, if a student scored 240 on last year’s math assessment, their academic peer group includes all students who also scored near 240. Growth percentiles compare a student’s current performance only against this similar group, not against all students in their grade.
Conclusion
Understanding how growth percentiles differ from proficiency levels gives you a sharper lens for interpreting standardized test results. Proficiency tells you whether a student has reached grade-level expectations at a given moment. Growth percentiles tell you whether that student is making meaningful progress over time compared to academic peers who started in the same place.
Neither metric is sufficient on its own. A student with strong growth but low proficiency is heading the right direction and may just need more time and support. A student who is proficient but showing flat growth might need a bigger challenge. The richest conversations happen when you look at both numbers side by side and ask what they tell you together.
If you are a parent, the next step is to pull out your child’s most recent state test report and locate both the proficiency level and the growth percentile. Bring both numbers to your next parent-teacher conference. Ask what they reveal about your child’s learning trajectory and what supports or enrichment would help them keep climbing.
If you are an educator, the next step is to make sure families understand both metrics when reports go home. A short note explaining the difference between destination and journey can turn confusion into a productive conversation about real student progress.