
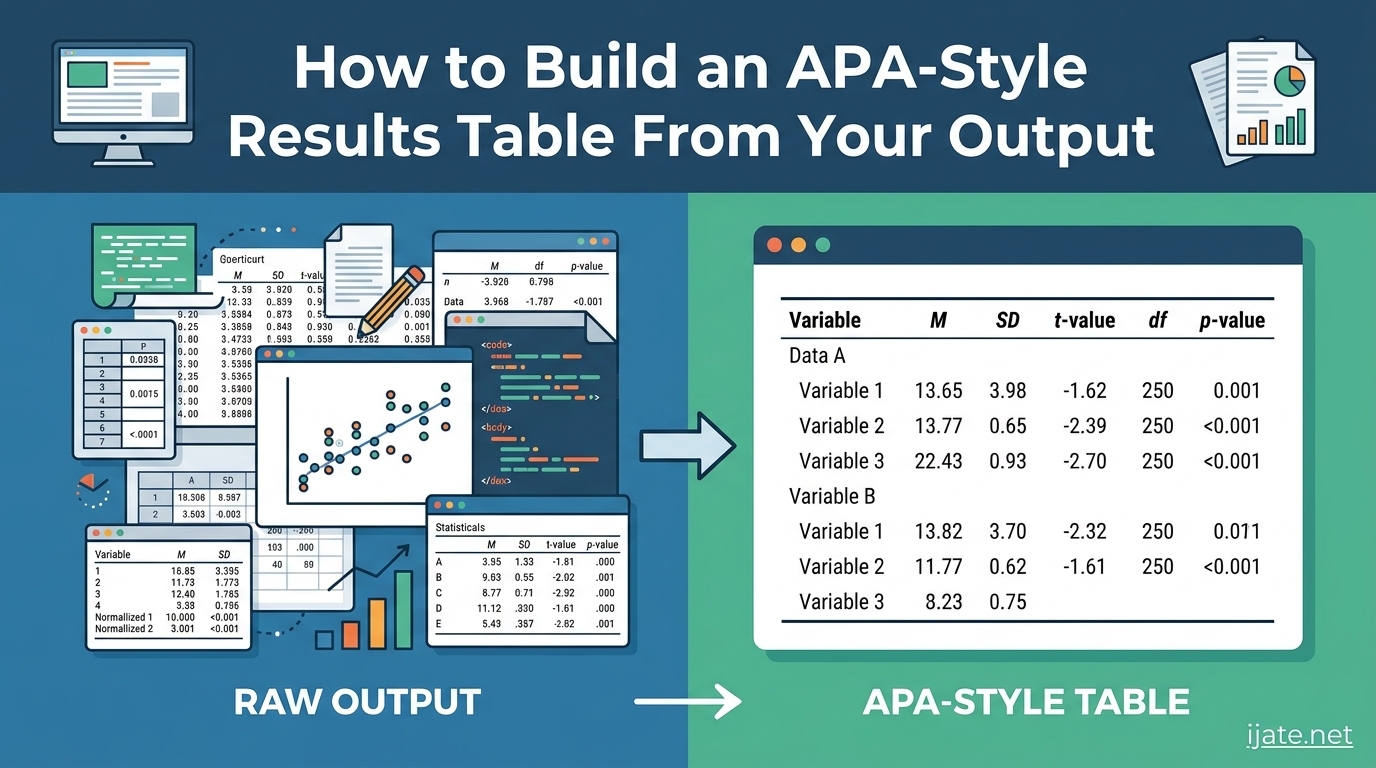
If you have ever stared at a wall of SPSS, R, or Stata output and wondered how to turn it into a clean, journal-ready table, you are in the right place. Building an APA-style results table from your output is one of the most common tasks in academic writing. It is also one of the most frustrating for new researchers because the rules feel specific, the formatting is unforgiving, and small mistakes can cost you points on a thesis or delays in peer review.
An APA style results table is a structured data presentation format defined by the Publication Manual of the American Psychological Association, currently in its 7th edition. It is used to display statistical findings clearly and consistently across psychology, education, nursing, social sciences, and many other disciplines. In this guide, I will walk you through every component, formatting rule, and step you need to build one from raw statistical output.
We will cover what an APA table actually is, the five core components, a complete step-by-step workflow, formatting rules for borders and alignment, sample tables for correlation, regression, and ANOVA, how to format notes correctly, common mistakes to avoid, and a quick-reference checklist you can run before submission. By the end, you will be able to take virtually any statistical software output and convert it into a table that meets APA 7th edition standards.
This guide is built for graduate students writing theses or dissertations, early-career researchers preparing manuscripts, and anyone publishing in journals that require APA format. I have used this exact workflow across dozens of my own papers and reviewed hundreds more as a peer reviewer, so the steps below reflect what actually gets accepted.
Table of Contents
What Is an APA-Style Results Table?
An APA-style results table is a standardized table format used to present quantitative data in academic research. It follows the guidelines set by the Publication Manual of the American Psychological Association, 7th edition. The format exists so that readers across journals, disciplines, and institutions can interpret statistical findings the same way.
Think of it as a common language for data. Whether you are reporting a t-test, an ANOVA, a regression, or descriptive statistics, the structure stays consistent. A reader who knows APA format knows exactly where to find the table number, what the title means, how to read the column headings, and where to look for explanatory notes.
APA tables are not just decorative. The Publication Manual is clear that you should use a table only when the data cannot be presented clearly in a few sentences of text. If two columns and two rows would do the job, the manual prefers you write it out. Tables earn their space when they organize complex data more efficiently than prose could.
The 7th edition introduced several updates from the 6th edition that you should know. Table numbers and titles now appear on separate lines above the table, both in bold and italic respectively. Tables can now be printed in either portrait or landscape orientation. Cell borders are simplified to three horizontal lines. These changes make APA 7 tables cleaner and easier to read than the older format.
Knowing what an APA-style results table is sets the foundation. The rest of this guide walks through how to actually build one from scratch.
Key Components of an APA Table
Every APA-style results table is built from five core components. Once you understand these pieces, the assembly process becomes much simpler. Each component has a fixed position and a specific formatting rule, and reviewers look at all five.
1. Table Number
The table number is the first thing the reader sees. In APA 7th edition, table numbers are written in bold, plain text above the table. They follow the format “Table 1,” “Table 2,” and so on, numbered in the order they appear in your manuscript.
Do not number tables alphabetically or by importance. If your dissertation has six tables, they are numbered 1 through 6 in the order they appear in the body text. Every table in your paper must be referenced by its number somewhere in the prose.
2. Table Title
Directly below the number, write the title in italic title case. The title should be descriptive and specific. A weak title like “Results” tells the reader nothing. A strong title like “Correlation Between Study Hours and Exam Scores in Undergraduate Students” tells the reader exactly what the table contains.
Keep the title to one line when possible. Avoid filler phrases like “A Table Showing” or “Table of.” Start with the key variable or relationship the table reports.
3. Column Headings
Column headings label the data in each column. In APA 7, headings sit above the top border line of the table body. Use clear, concise labels. Statistical symbols like M, SD, N, p, r, t, and F should be italicized because they are statistical abbreviations.
If your table has grouped columns, use a column spanner. A spanner is a single heading that sits above two or more subheadings, grouped under a wider category. For example, you might have a spanner reading “Experimental Group” covering subcolumns for n, M, and SD.
For tables with two levels of headings, you can also use decked heads. A decked head stacks two headings vertically within a single column, separated by a horizontal line. This is common when you need to report both the statistic and its units.
4. Table Body
The body contains the actual data. Rows are read from left to right, and the leftmost column typically holds the stub column, which labels each row. Align text columns to the left and numeric columns to the decimal point or center. Keep decimal places consistent within a column, usually two or three, depending on the statistic.
Blank cells are not allowed in APA tables. If a value is not applicable, use an em dash. If data is missing, use a note explaining why. Every cell in the body should contain either a number, a label, or a deliberate placeholder.
5. Table Notes
Notes appear below the bottom border of the table. APA recognizes three types: general notes, specific notes, and probability notes. Each has its own formatting, which we cover in a dedicated section later in this guide.
How to Build an APA-Style Results Table From Your Output (Step-by-Step)
This is the section most guides skip. They tell you what an APA table looks like, but not how to actually get there from raw software output. Here is the workflow I use, broken into clear numbered steps that work for SPSS, R, Stata, JMP, or any other statistical package.
Step 1: Decide Whether You Need a Table
Before you format anything, ask whether a table is necessary. If your result is a single statistic with a couple of values, prose is usually better. A table pays off when you have multiple comparisons, multiple variables, repeated data points across conditions, or descriptive statistics for many subgroups.
Save yourself formatting time if the data does not need a table. Reviewers and editors will appreciate the brevity.
Step 2: Identify the Statistics You Need to Report
Look at your raw output and circle exactly what you need. For an ANOVA, that is usually the F statistic, degrees of freedom, p value, and effect size. For a regression, it is the unstandardized and standardized coefficients, standard errors, t values, and p values. Resist the urge to copy every number your software produces. APA tables report what matters, not what is available.
Write your list on a sticky note or in a scratch document. You will refer back to it as you build the table.
Step 3: Sketch the Table Layout on Paper
Before opening Word, sketch the layout. Decide what goes in rows and what goes in columns. As a rule of thumb, put comparison categories in columns and variables or measures in rows. This keeps the table narrow and easier to read across a printed page.
A sketch also helps you catch layout problems early. If you find yourself cramming seven columns onto a portrait page, you may want to switch to landscape or rethink the structure.
Step 4: Insert a Table in Microsoft Word
In Word, go to Insert, then Table, then choose the number of rows and columns you need. Do not worry about borders yet. Type your headings in the first row, your stub labels in the first column, and your data in the cells.
If you are coming from R, you can use the flextable package or the rempsyc package to export a pre-formatted table directly to Word. If you are coming from SPSS, copy your output table and paste it into Word as plain text, then reformat manually. Pasting as a formatted SPSS table brings in unwanted borders and styling.
Step 5: Apply the Three APA Border Lines
This is the step where most students go wrong. APA 7 tables use only horizontal lines, never vertical lines. You need exactly three borders: one above the column headings, one below the column headings, and one at the very bottom of the table.
To add them in Word, select the relevant rows, go to Table Design, click Borders, and use Top Border and Bottom Border as needed. Remove all other borders, including any default gridlines your table came with. The result should look clean and open.
Step 6: Format the Table Number and Title
Above the top border, type your table number in bold (for example, “Table 1”). Press Enter, then type the title in italic title case on the next line. Center both lines over the table width. There is no period after the number or the title.
Step 7: Align the Cells
Left-align the stub column and any text columns. Center-align or decimal-align numeric columns. Use the same number of decimal places throughout each column. APA commonly recommends two decimals, though three is acceptable for precise statistics like correlations.
To decimal-align in Word, you may need to insert a decimal tab stop. This lines up numbers on the decimal point rather than the left or right edge of the cell, which looks much cleaner in published tables.
Step 8: Italicize Statistical Symbols
Every statistical symbol must be italicized. This includes N, M, SD, SE, p, r, t, F, df, and Greek letters like β. Do not italicize numbers, parentheses, equals signs, or subscripts that are not statistical symbols.
This rule trips up many students because Word sometimes auto-corrects or strips italics. Do a final pass through the table to confirm every symbol is properly italicized.
Step 9: Add Notes Below the Table
Below the bottom border, add your notes. Start with a general note in plain text that explains abbreviations, data sources, or sample sizes. Use superscript lowercase letters for specific notes tied to particular cells. Use asterisks for probability notes marking significance levels.
Step 10: Double-Check Against the APA Manual
Run your finished table against the APA 7th edition checklist before submission. Check the order of components, the borders, the italics, the alignment, and the note formatting. A five-minute review at this stage saves hours of revision later.
I keep the checklist printed at my desk for every manuscript. It catches errors my eye skips over after hours of writing.
Formatting Guidelines: Borders, Alignment, and Spacing
Formatting is where most APA tables either pass or fail. The rules are strict, but they are also simple once you internalize them. This section expands on the formatting fundamentals that the step-by-step workflow touched on.
Border Rules
APA 7 tables use only horizontal borders. The three required lines are: the top border above the column headings, a border beneath the column headings, and a bottom border at the foot of the table. No vertical lines, no inner gridlines, no shading. If a heading spans multiple subcolumns, you may add a short horizontal spanner line beneath the parent heading.
Vertical lines were acceptable in older editions and in some other formatting styles, which is why you still see them in legacy documents. APA 7 explicitly removes them to make tables easier to scan visually.
Alignment Rules
Align text columns to the left. Align numeric columns to the decimal point whenever possible, or center them if decimal alignment is impractical. Keep the stub column left-aligned. Consistency matters more than the specific choice, so pick one approach per column and stick with it.
Center the table horizontally on the page. Tables do not span the full page width by default. Leave roughly one inch of margin on either side.
Spacing and Font Rules
APA 7 tables are double-spaced throughout, including within and between rows. Use the same font as the body of your paper. APA 7 recommends sans serif fonts like Calibri or Arial at 11 point, or serif fonts like Times New Roman at 12 point. Statistical symbols, subscripts, and superscripts follow standard typographic conventions.
Double-spacing can make large tables feel sprawling. If your table is too tall for one page, consider splitting it or moving some statistics to an appendix. Avoid reducing spacing to fit a table on one page; reviewers prefer correct formatting over compact layout.
Number Formatting Rules
Report numbers in the body of the table without leading zeros for statistics that cannot exceed 1.0, such as correlations and p values. So p = .034, not p = 0.034. For statistics that can exceed 1.0, such as means or F values, include the leading zero: F = 4.56.
Use the same number of decimal places within each column. APA generally recommends two decimals for most statistics. Three decimals are acceptable for correlations, proportions, and very precise estimates.
Sample APA Tables by Type (Correlation, Regression, ANOVA)
Examples make the rules concrete. Below are brief structural descriptions of the three most common APA tables. Use them as templates when you build your own.
Correlation Table
A correlation table lists variables down the stub column and across the top, with the same variables in the same order. Below the diagonal, you report correlation coefficients. Above the diagonal, you can report descriptive statistics like M and SD, or leave it blank. Use asterisks to mark significance levels, with one asterisk for p less than .05 and two for p less than .01. A note explains what each asterisk means.
The diagonal of a correlation table is typically left blank or filled with dashes, since a variable correlates perfectly with itself. Some authors report reliability coefficients on the diagonal instead.
Regression Table
A regression table typically lists predictors down the stub column. Columns report unstandardized coefficients (B), standard errors (SE), standardized coefficients (β), t values, and p values. Some authors add confidence intervals for the coefficients. Model summary statistics like R2 and adjusted R2 go in a general note or in a separate row at the top of the body.
For hierarchical or block regression, list predictors in the order they were entered into the model. This makes the incremental contribution of each block visible to the reader.
ANOVA Table
An ANOVA table lists sources of variance in the stub column: between-groups, within-groups, and total. Columns show sums of squares, degrees of freedom, mean squares, F values, and p values. Effect size measures like η2 or ω2 are commonly added as an extra column or reported in a note.
For factorial ANOVA, list each main effect and interaction on its own row. Indent interaction rows slightly to show they are sub-effects of the overall model.
Descriptive Statistics Table
Descriptive statistics tables are common in demographics sections. Variables go in the stub column. Columns report N, M, SD, and possibly range or skewness. If you have multiple groups, add columns for each group or use a single column with subrows per group.
t-Test Results Table
A t-test table lists the dependent variable in the stub column. Columns report M, SD, and N for each group, plus t, df, p, and Cohen’s d. Some authors report 95% confidence intervals for the mean difference.
How to Format APA Table Notes (General, Specific, Probability)
Notes are easy to overlook, but reviewers check them. APA recognizes three types, each with a strict format. Order them top to bottom: general notes first, then specific notes, then probability notes.
General Notes
General notes apply to the entire table. They explain abbreviations, identify the source of the data, define symbols, and provide context. Start a general note with the word “Note.” in italics, followed by the text in plain font. Place it flush left below the bottom border.
A typical general note reads something like: “Note. N = 312. SAT = Scholastic Assessment Test. GPA = grade point average.”
Specific Notes
Specific notes refer to a particular row, column, or cell. Mark them with superscript lowercase letters (a, b, c) attached to the relevant cell. Below the table, list them in alphabetical order, each starting with the matching superscript letter.
For example, you might attach a superscript “a” to a specific mean and explain below: “a Mean differs significantly from baseline at p < .01.”
Probability Notes
Probability notes report significance levels. Attach asterisks to relevant values in the table. Use one asterisk for p less than .05, two for p less than .01, and three for p less than .001. Below the table, list them like this: “* p < .05. ** p < .01.” APA 7 does not report p values lower than .001 with extra precision.
Avoid the older “ns” notation for non-significant results. APA 7 prefers reporting the exact p value instead.
Software-Specific Export Tips
Different statistical packages handle APA formatting differently. Here is what to expect from each.
R
The R ecosystem has the strongest APA support. The flextable package builds Word-ready tables with full control over borders and italics. The rempsyc package wraps flextable specifically for APA-style statistical output. The apaTables package produces pre-formatted APA tables for ANOVA and regression with a single function call.
SPSS
SPSS does not export APA-formatted tables directly. The fastest workflow is to copy the relevant output, paste it into Word as plain text, and reformat manually. Some third-party SPSS extensions automate APA export, but manual reformatting remains the most reliable approach.
Stata
Stata has several user-written commands for APA export. The estout and esttab commands can produce formatted tables for regression results. For descriptive statistics, the table command combined with manual cleanup is the most reliable path.
Excel
Excel can be an intermediate stop for R or SPSS output. Copy your data into Excel, clean it up, then copy from Excel into Word. Be aware that Excel adds borders and formatting that you will need to strip out in Word.
Common Mistakes to Avoid
Reviewers see the same errors over and over. Here are the most frequent ones, along with quick fixes.
- Vertical borders. APA tables never use vertical lines. Remove them all.
- Too many decimals. Stick to two decimals for most statistics. Use three only for correlations or precise estimates.
- Forgotten italics. Every statistical symbol must be italicized, including N, M, SD, p, and F.
- Generic titles. Replace “Table 1: Results” with descriptive titles like “Table 1. Means and Standard Deviations for Test Scores by Group.”
- Copying raw output. Never paste SPSS or R output directly. Reformat the values you need into a clean APA table.
- Missing notes. Always include at least a general note explaining abbreviations.
- Inconsistent alignment. Pick one alignment per column type and apply it uniformly.
- Wrong number format. Report p values with no leading zero (for example, p = .034, not p = 0.034).
- Period after title. Do not add a period after the table title.
- Forgotten table reference. Every table must be referenced in the body text by its number.
- Blank cells. Use an em dash for non-applicable cells rather than leaving them empty.
- Wrong heading order. The order is always general notes, then specific notes, then probability notes.
APA Table Checklist for Review
Before you submit, run through this checklist. If every item is yes, your table is in good shape.
- Table number in bold above the title?
- Title in italic title case, descriptive, and centered?
- Three horizontal borders only (top, below headings, bottom)?
- No vertical borders or shading anywhere?
- Statistical symbols italicized throughout?
- Decimal places consistent within each column?
- Numbers formatted correctly (no leading zero for p values)?
- Notes in the correct order (general, specific, probability)?
- Significance asterisks explained in a probability note?
- Table double-spaced and in the same font as the body text?
- Table referenced in the body text by its number?
- No blank cells left in the body?
- Same number of decimal places per column?
Print this checklist and tape it next to your monitor. It catches 90 percent of the errors reviewers flag in my own peer reviews.
FAQ’s
What is the proper APA table format for results?
How do you format a results table in APA 7th edition?
How do I create a demographic table in APA format?
What are the elements of an APA-style table?
Do APA tables use vertical lines?
How do I report p-values in an APA table?
Conclusion
Building an APA-style results table from your output becomes straightforward once you break it into the five core components and follow the ten-step workflow. Decide what to report, sketch the layout, set the three horizontal borders, italicize your symbols, align your decimals, and add the right notes. Knowing how to build an APA-style results table from your output is a skill that pays off across your entire academic career, from coursework to publication.
Start with the checklist above for your next table, and you will catch most issues before any reviewer does. Once the structure becomes routine, you can focus on what really matters: the substance of your findings and the story your data tells.