
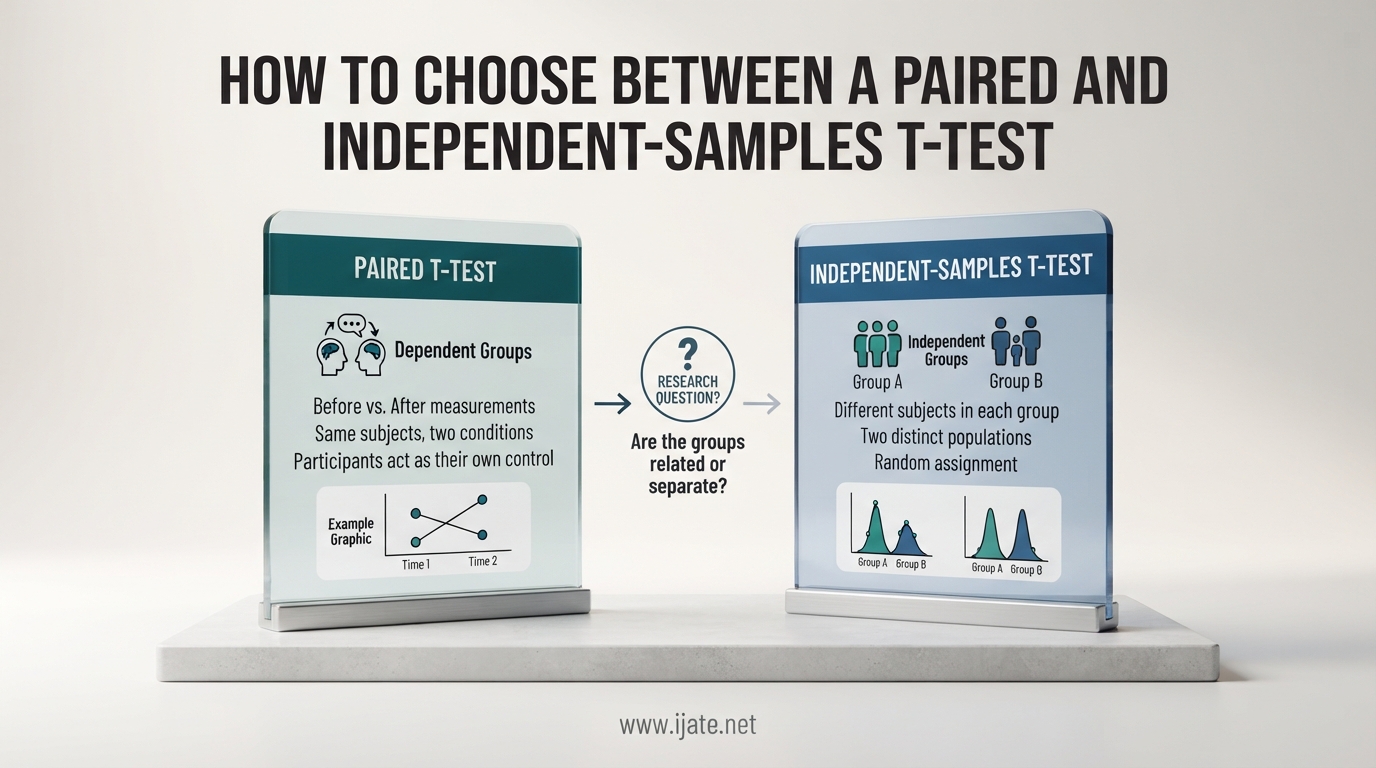
Use a paired samples t-test when the same subjects are measured twice or when observations come in naturally matched pairs, and use an independent samples t-test when you are comparing two separate, unrelated groups of people or units. The two-sample t-test is used when the data of two samples are statistically independent, while the paired t-test is used when data is in the form of matched pairs. That single distinction, dependent versus independent observations, drives every other difference between the two tests.
If you have ever frozen in front of your statistics software trying to remember whether your scenario calls for a paired or an independent t-test, this guide will walk you through the decision in plain language. We will cover what each test does, how to identify your data structure, the assumptions you must check, real-world examples, common mistakes, and a four-step decision rule you can apply in under a minute.
Choosing the wrong test is not a small technicality. Running an independent t-test on paired data throws away statistical power, making it harder to detect a real effect. Running a paired t-test on independent data produces invalid results because the pairing structure does not exist. Getting this choice right protects the validity of your conclusions and the credibility of your research.
Table of Contents
Quick Answer: The One-Sentence Decision Rule
If each observation in one group has a direct, natural link to exactly one observation in the other group, use a paired t-test. If no such link exists, use an independent samples t-test.
Here is a memory trick that students and researchers consistently find useful: Same subjects, paired test. Different subjects, independent test. That phrase covers the vast majority of real-world scenarios, and we will refine it further with examples in the sections below.
Another way to phrase it is to ask whether a single person, object, or unit contributes data to both groups. If yes, you are in paired territory. If each person appears in only one group, you are in independent territory. This simple question resolves most confusion before it starts.
What Is a Paired Samples t-Test?
A paired samples t-test compares the mean of the differences between two sets of matched observations to zero. Instead of comparing two group means directly, it subtracts one measurement from its paired partner, then tests whether the average of those differences is statistically different from zero.
This is why some textbooks describe the paired t-test as a one-sample t-test performed on the difference scores. Once you compute each pair’s difference, the problem collapses into a single sample of differences, and you test whether the mean of that sample equals zero. This insight helps clarify why the paired test has its own degrees of freedom formula and its own power characteristics.
The paired test is appropriate whenever observations in the two groups are naturally linked. Common scenarios include before-and-after measurements on the same people, pre-test and post-test designs, experiments where twins or siblings are split between two conditions, and studies where participants are matched on key characteristics such as age, sex, or baseline score.
In all of these cases, the pairing captures a source of variability that would otherwise inflate your error term. By accounting for the natural correlation between paired observations, the test becomes more sensitive to the actual treatment effect. That is the core reason a paired design tends to have higher statistical power when the pairing is genuinely present in the data.
Note that the paired t-test goes by several names in textbooks and software. You may see it called a dependent samples t-test, a matched pairs t-test, a repeated measures t-test, or simply a paired difference test. They all refer to the same procedure.
What Is an Independent Samples t-Test?
An independent samples t-test compares the means of two separate, unrelated groups to determine whether they are statistically different from each other. Each participant appears in only one group, and there is no natural link between a given observation in group one and a given observation in group two.
This test is appropriate when your two groups come from different populations or from randomly assigned different conditions. Classic examples include comparing a treatment group to a control group in a clinical trial, comparing test scores between two different classrooms, comparing satisfaction ratings between customers in two different cities, or comparing reaction times between a placebo group and a drug group where each person received only one of the two.
The independent t-test evaluates whether the difference between the two sample means is larger than what you would expect from random sampling variation alone. It does so by comparing that difference to the standard error of the difference, which incorporates the variability within each group and the size of each sample.
This test is also known by several aliases. You will see it called a two-sample t-test, an unpaired t-test, or simply an independent t-test. In software output, look for terms like “equal variances assumed” and “equal variances not assumed,” which refer to two slightly different versions of the test depending on whether the two groups have similar variability.
Because the groups are independent, there is no correlation between observations to account for. This makes the formula and the degrees of freedom calculation different from the paired version, and it also means the test generally requires larger sample sizes to achieve the same statistical power when a paired design would have been possible.
Key Differences: Paired vs Independent Samples t-Test
The fundamental difference between a paired vs independent samples t-test lies in the relationship between observations across the two groups. Every other difference, from degrees of freedom to statistical power, flows from that single source.
Here is a summary of how the two tests differ across the dimensions that matter most in practice:
- Data structure: Paired requires matched observations; independent requires two separate groups with no linking.
- What is being tested: Paired tests whether the mean difference within pairs equals zero; independent tests whether the difference between two group means equals zero.
- Degrees of freedom: Paired uses the number of pairs minus one, written as n minus 1; independent uses the total number of observations minus two, written as n1 plus n2 minus 2.
- Variance consideration: Paired focuses on the variance of the difference scores; independent pools the variance from both groups.
- Statistical power: Paired tends to have higher power when the pairing captures real correlation, because it removes between-subject variability from the error term.
- Sample size requirement: Paired requires the same number of observations in each group; independent can handle unequal group sizes.
The degrees of freedom difference deserves a closer look. In a paired test with 20 pairs, you have 19 degrees of freedom because the test works with 20 difference scores. In an independent test with 20 people in each group, you have 38 degrees of freedom because the test works with 40 individual observations. Even though the independent test has more degrees of freedom, the paired test often produces a larger t-statistic because the variance of the differences is smaller when pairing is effective.
Statistical power is where the practical impact becomes most visible. When observations are genuinely correlated within pairs, the paired design removes a large chunk of between-subject noise. The result is a tighter standard error, a larger t-statistic for the same effect size, and a greater chance of detecting a true effect. This is why researchers go to considerable effort to design paired studies when the option exists.
However, this power advantage disappears, and can even reverse, if there is no real correlation within pairs. If you force a paired analysis onto data where pairing carries no meaningful relationship, you lose degrees of freedom without gaining any reduction in variance. The test becomes less powerful, not more. This is why correctly identifying whether your data is genuinely paired matters so much.
How to Identify Whether Your Samples Are Paired or Independent
Identifying your data structure is the most important step in choosing between a paired and independent samples t-test. Once you classify your data correctly, the test choice follows automatically.
Use this three-question checklist to diagnose your data structure:
Question 1: Is the same person, object, or unit measured under both conditions? If yes, your data is paired. This covers before-and-after designs, repeated measures, and any situation where the identical entity contributes a score to each group.
Question 2: Were participants deliberately matched on key characteristics before being assigned to different groups? If yes, and the matching is one-to-one, your data is paired. Examples include matching twins, siblings, or participants matched on age and baseline score.
Question 3: Could you shuffle all the data points into two new groups without losing any information? If yes, your data is independent. If shuffling would destroy meaningful pairings, your data is paired.
If you answered yes to Question 1 or Question 2, use a paired t-test. If you answered yes to Question 3, use an independent t-test. This three-question framework resolves the vast majority of real-world cases without requiring you to revisit the statistical theory each time.
A few data structures tend to confuse people. Repeated measures designs, where the same participants complete multiple conditions, are always paired even though the conditions differ. Cross-sectional designs, where you sample two different populations at the same time, are always independent even if the populations are similar in composition.
Longitudinal studies that track the same individuals over multiple time points are paired when you compare two specific time points. If you are comparing more than two time points, you would move beyond the t-test to a repeated measures analysis of variance, but the paired logic still applies.
When participants are matched but the matching is not one-to-one, for example matching in groups of three, the simple paired t-test no longer applies cleanly. In those cases, consult a statistician or use a more general repeated measures model rather than forcing the data into a paired framework.
Assumptions You Need to Check Before Running Either Test
Both the paired and independent t-tests rest on assumptions that must hold for the results to be trustworthy. Checking these assumptions is not optional busywork; violations can distort your p-values and lead you to false conclusions.
For the paired samples t-test, three assumptions apply. First, the differences between paired observations should be approximately normally distributed. Note that it is the differences that need normality, not the raw scores themselves. This is a point many people miss. Second, the pairs must be independent of each other. One person’s before-and-after pair should not influence another person’s pair. Third, the dependent variable should be measured on a continuous scale.
For the independent samples t-test, four assumptions apply. First, each group’s observations should be approximately normally distributed. Second, the two groups should have approximately equal variances, a property called homogeneity of variance. If this assumption fails, use the Welch version of the test, which does not assume equal variances. Third, observations within and between groups must be independent. Fourth, the dependent variable should be continuous.
What happens when normality fails? For small samples where normality is clearly violated, switch to a nonparametric alternative. The paired equivalent is the Wilcoxon signed-rank test, which works on the ranks of the differences rather than the raw values. The independent equivalent is the Mann-Whitney U test, also called the Wilcoxon rank-sum test, which compares the distributions of two groups without assuming normality.
For larger samples, typically 30 or more per group, the central limit theorem provides some protection against non-normality. The t-test becomes reasonably robust to moderate departures from normality as sample size grows. However, extreme outliers or heavily skewed distributions can still cause problems even at larger sample sizes, so always inspect your data visually before trusting the numbers.
Homogeneity of variance for the independent test is typically checked with Levene’s test. A significant Levene’s result suggests unequal variances, and you should report the Welch version of the t-test instead of the pooled version. Most statistical software reports both versions side by side, so switching is straightforward.
Real-World Examples: Paired vs Independent t-Test Scenarios
Working through concrete examples is the fastest way to internalize the decision rule. Here are four scenarios that cover the most common patterns you will encounter.
Example 1: Pre-test and post-test on the same students. A teacher administers a math test to 25 students, delivers a new instructional method for six weeks, then administers a parallel form of the same test. Each student has two scores. This is a textbook paired design. Use a paired t-test on the 25 difference scores.
Example 2: Two different classrooms taught with different methods. A researcher compares math scores from Classroom A, taught with method one, to scores from Classroom B, taught with method two. The classrooms contain different students, and no student appears in both groups. This is a classic independent design. Use an independent samples t-test.
Example 3: Twins split between a treatment and a control condition. Twenty pairs of identical twins are recruited for a study on a reading intervention. Within each pair, one twin receives the intervention and the other serves as a control. Although the twins are different people, each pair shares genetics and environment, creating a natural matching. Use a paired t-test with 20 twin pairs.
Example 4: A common mistake scenario. A researcher collects blood pressure readings from 30 patients in a hypertension clinic and 30 patients in a general medicine clinic. The researcher wonders whether to use a paired test because both groups have 30 people. This is incorrect. Having the same number of observations does not create pairing. The groups consist of different people with no natural link. Use an independent t-test.
Example four illustrates one of the most frequent mistakes we see in practice. Equal sample sizes do not mean paired data. Pairing requires a meaningful one-to-one correspondence between specific observations, not just matching group sizes.
Another tricky case involves matched designs where participants are paired on a single variable like age. If the matching is deliberate and one-to-one, and you intend to analyze the data as pairs, a paired test is appropriate. If you simply recruited similar participants into two groups without tracking which person corresponds to which, you cannot reconstruct the pairs and must use an independent test.
Common Mistakes When Choosing a t-Test
Even experienced researchers make errors when selecting between paired and independent tests. Knowing these pitfalls in advance helps you avoid them.
Mistake 1: Using an independent t-test on naturally paired data. This is the most common and most costly error. By ignoring the pairing structure, you treat between-subject variability as random noise rather than removing it. The result is a smaller t-statistic, a larger p-value, and a higher chance of a Type II error where you fail to detect a real effect.
Mistake 2: Using a paired t-test on independent data. This error is less common but more obviously wrong. If the data has no natural pairing, the difference scores are meaningless, and the test results are invalid. You lose degrees of freedom without any variance reduction, producing unreliable p-values.
Mistake 3: Checking normality of raw scores instead of differences. For a paired t-test, the normality assumption applies to the difference scores, not the original measurements. People often run normality tests on the raw before-and-after values and conclude the assumption is violated when the differences are actually fine.
Mistake 4: Assuming equal sample sizes mean the data is paired. As shown in Example 4 above, equal group sizes are necessary for a paired analysis but not sufficient. You need a genuine one-to-one correspondence between specific observations.
Mistake 5: Forgetting to check homogeneity of variance for the independent test. Ignoring Levene’s test or its equivalent can lead to using the wrong version of the independent t-test. When variances are clearly unequal, the Welch version gives more accurate results.
Avoiding these five mistakes covers the large majority of errors that crop up in published research, classroom assignments, and real-world data analysis projects.
Step-by-Step Decision Guide: Choosing Your t-Test
Here is a four-step decision process you can apply to any dataset in under a minute. Work through the steps in order, and stop as soon as you have a clear answer.
Step 1: Identify your research question. Are you comparing the means of two groups or conditions? If yes, a t-test of some kind is appropriate. If you have more than two groups, consider ANOVA instead.
Step 2: Examine the data structure. Look at how your data is organized. Does each row in your dataset represent a single observation (long format) or a pair of observations for one unit (wide format)? If each unit appears twice, once per condition, you have paired data. If each unit appears only once, you have independent data.
Step 3: Ask the linking question. For each observation in group one, can you identify the specific corresponding observation in group two? If you can name the partner, the data is paired. If you cannot, the data is independent.
Step 4: Confirm assumptions and run the test. Once you know whether the data is paired or independent, check the relevant normality and variance assumptions described earlier. Then run the appropriate t-test, or switch to a nonparametric alternative if assumptions fail.
This four-step framework is the practical version of everything covered in this guide. If you internalize it, you will rarely second-guess your test choice again.
FAQs
When should you use a paired t-test instead of an independent t-test?
Use a paired t-test when the same subjects are measured twice, when participants are matched one-to-one, or when observations come in naturally linked pairs. Common examples include before-and-after measurements, pre-test post-test designs, and twin studies. If each data point in one group has a specific partner in the other group, choose the paired test.
How to know if samples are independent or paired?
Samples are paired if each observation in one group has a direct, natural link to exactly one observation in the other group, such as the same person measured twice or matched twins. Samples are independent if no such link exists and each participant appears in only one group. Ask whether you can identify a specific partner for each data point; if yes, the data is paired.
How to choose paired or unpaired t-test?
Ask one question: does each observation in group one have a specific, identifiable partner in group two? If yes, use the paired (unpaired is the same as independent) t-test approach for paired data. If no natural pairing exists and the groups consist of different, unrelated participants, use the unpaired or independent t-test.
When should you use an independent sample t test?
Use an independent samples t-test when comparing the means of two separate, unrelated groups where each participant appears in only one group. Examples include comparing a treatment group to a control group, comparing scores from two different classrooms, or comparing outcomes between two different populations sampled independently.
Why is the paired t-test more powerful than the independent t-test?
The paired t-test is more powerful when the pairing captures real correlation because it removes between-subject variability from the error term. This produces a smaller standard error for the same effect size, leading to a larger t-statistic and a greater chance of detecting a true effect. However, this advantage only holds when the pairing is genuine.
Conclusion
Learning how to choose between a paired and independent-samples t-test comes down to one question: are your observations naturally linked across the two groups? If yes, use a paired test. If no, use an independent test. The memory trick, same subjects paired, different subjects independent, will guide you correctly in nearly every scenario.
Remember to check the assumptions specific to each test, including normality of differences for the paired test and homogeneity of variance for the independent test. When assumptions fail, switch to the appropriate nonparametric alternative rather than forcing an invalid analysis.
Next time you face a t-test decision, run through the four-step guide: identify your question, examine the data structure, ask the linking question, and confirm your assumptions. That sequence takes less than a minute and protects the integrity of your conclusions.