
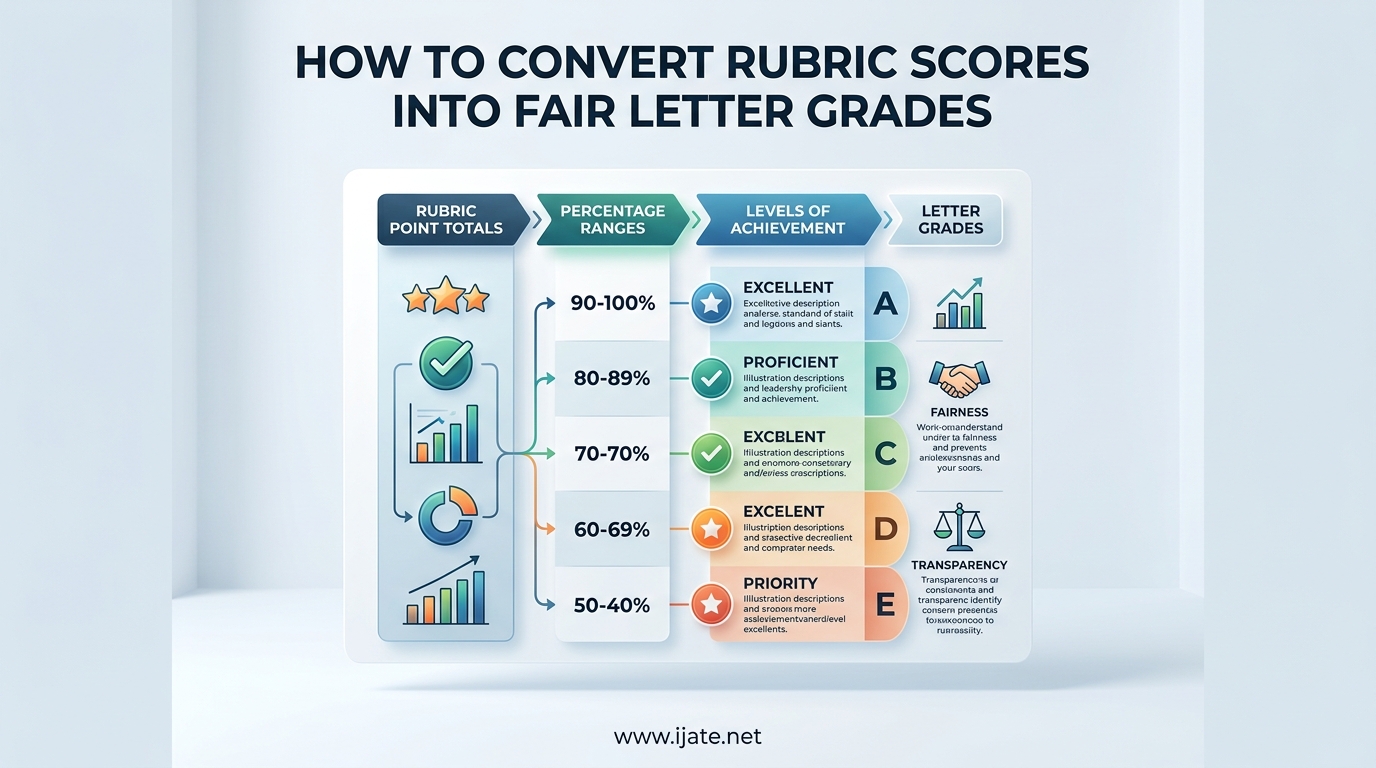
If you have ever stared at a completed rubric and wondered how those checkmarks and level descriptors turn into a letter grade for your gradebook, you are not alone. I have spent years working with teachers who tell me the same thing: the rubric itself makes sense, but the conversion feels like guesswork. Learning how to convert rubric scores into fair letter grades is one of the most common challenges educators face, whether they teach kindergarten writing or college-level engineering.
The problem is not a lack of effort. Most teachers design thoughtful rubrics with clear criteria and performance levels. The gap lies in translating those qualitative judgments into quantitative scores that match a traditional grading scale. One teacher might treat a score of 3 out of 4 as a 75 percent, landing a strong student at a C. Another might call it an 85 percent, putting the same work in the B range. That inconsistency frustrates students, confuses parents, and undermines the assessment process.
This guide breaks down the entire conversion process into clear, actionable steps. I will walk you through rubric fundamentals, a proven step-by-step method, conversion charts for every common rubric scale, weighting strategies, common mistakes, and fairness considerations. Whether you are new to rubric grading or refining a system you have used for years, you will find practical examples with real numbers you can apply today.
Throughout this article, I draw on classroom experience, teacher forum discussions, and educational research, including high school performance task assessment practices that rely on rubric-based evaluation. The goal is simple: help you convert rubric scores in a way that is fair, consistent, and defensible to everyone involved.
Table of Contents
Quick Answer: How to Convert Rubric Scores Into Fair Letter Grades
Here is the process in seven steps, designed for immediate classroom use:
- Define your rubric criteria and assign a maximum point value to each one.
- Set performance levels (such as Exceeds, Meets, Approaching, Beginning) and determine what each level earns.
- Score the student work by marking the performance level achieved for each criterion.
- Add up the earned points across all criteria to get the total raw score.
- Divide by the total possible points and multiply by 100 to get the percentage.
- Map the percentage to your grading scale (90 to 100 equals A, 80 to 89 equals B, and so on).
- Apply weighting if needed so more important criteria carry more influence on the final grade.
The key principle: decide what each performance level means as a percentage before you grade, not after. This prevents the most common mistake teachers make, which is treating rubric levels as raw points rather than performance indicators.
Understanding Rubric Types and Scoring
Before diving into conversion formulas, it helps to understand what kind of rubric you are working with. Different rubric structures require slightly different conversion approaches.
What Is a Rubric Score?
A rubric score is the result of evaluating student work against predefined criteria and performance levels. Instead of assigning an arbitrary number, you compare the work to descriptors that define what quality looks like at each level. The score reflects how closely the work matches those descriptors.
For example, on a 4-point rubric, a score of 4 might mean “demonstrates thorough understanding with no significant errors,” while a 2 means “shows partial understanding with several errors.” The number itself is shorthand for a qualitative judgment.
The challenge arises because a rubric score of 3 out of 4 is not the same as 75 percent in terms of achievement. A student who “meets expectations” on every criterion has done good work, and most teachers would agree that should not translate to a C grade. This is where intentional conversion becomes essential.
Analytic vs Holistic vs Single-Point Rubrics
Three rubric formats dominate classroom assessment, and each handles conversion differently.
Analytic rubrics break the assignment into separate criteria, each scored independently. A writing rubric might have five criteria (ideas, organization, voice, word choice, conventions), each scored on a 4-point scale. You get detailed diagnostic information and can weight criteria differently. Conversion involves adding or averaging scores across criteria.
Holistic rubrics assign a single overall score based on the entire piece of work. The assessor considers all criteria simultaneously and assigns one judgment. A holistic rubric might use a 6-point scale where 6 equals exceptional and 1 equals inadequate. Conversion is simpler because there is only one score to map, but you lose the diagnostic detail.
Single-point rubrics list only the expectations for meeting the standard, with space to note areas that exceed or fall short. They do not use a numbered scale at all. Conversion requires the teacher to assign point values based on how far above or below expectations the work falls. This format offers flexibility but demands more judgment during conversion.
What Is a 4-Point Rubric Grading Scale?
A 4-point rubric grading scale uses four performance levels to evaluate each criterion. The levels typically represent a progression from below expectations to exceeding expectations:
- Level 4: Exceeds expectations (advanced understanding, minimal to no errors)
- Level 3: Meets expectations (solid understanding, minor errors)
- Level 2: Approaching expectations (developing understanding, several errors)
- Level 1: Beginning (limited understanding, significant errors)
Some 4-point scales include a zero for work that is missing or shows no evidence of learning. The 4-point scale is popular because it aligns well with standards-based grading systems and forces a clear decision without a neutral middle option. Converting a 4-point rubric requires deciding what percentage each level represents, which I cover in the conversion chart section below.
How to Convert Rubric Scores Into Fair Letter Grades: Step-by-Step Method
Now let me walk you through the complete conversion process with real examples. I will use a middle school writing assignment as a running illustration so you can see how each step plays out with actual student work.
Step 1: Define Your Criteria and Point Values
Start by listing every criterion your rubric evaluates. For a persuasive essay, your criteria might be: claim and focus (4 points), evidence and support (4 points), organization (4 points), and language and conventions (4 points). This gives you a 16-point rubric total.
Write down the criteria and their maximum points before you look at any student work. Deciding point values in advance keeps your scoring objective and consistent across all submissions.
Step 2: Set Performance Level Percentages
This is the step most teachers skip, and it is the source of most unfair conversions. Before grading, decide what percentage each performance level represents. Here is a common framework that many educators find fair:
- Exceeds expectations (Level 4) equals 95 to 100 percent
- Meets expectations (Level 3) equals 85 percent
- Approaching expectations (Level 2) equals 70 percent
- Beginning (Level 1) equals 55 percent
- No evidence (Level 0) equals 0 to 40 percent
Notice that meeting expectations lands at 85 percent, a solid B. This reflects the idea that “meeting the standard” is good work, not average or below-average work. You can adjust these percentages to match your school’s grading culture, but make the decision intentionally.
Step 3: Score the Student Work
Read through each submission and mark the performance level achieved for every criterion. Use your rubric descriptors as the guide, not your overall impression of the student.
For our example, a student receives these scores: claim and focus at Level 3, evidence at Level 4, organization at Level 3, and conventions at Level 2. The raw total is 3 plus 4 plus 3 plus 2, which equals 12 out of 16 possible points.
Step 4: Calculate the Percentage
Divide the earned points by the total possible points and multiply by 100. In our example, 12 divided by 16 equals 0.75, multiplied by 100 gives you 75 percent.
But wait. If you remember our performance level percentages, meeting expectations should be an 85, not a 75. This student met expectations on two criteria, exceeded on one, and approached on one. A raw percentage calculation gives 75 percent, which feels too low for this profile.
This is where you have a choice: use raw percentage conversion or use performance-level-percentage conversion. I recommend the latter for fairness, and here is how it works.
Step 5: Choose Your Conversion Method
Method A: Raw percentage conversion. Simply divide earned points by total points. This is the simplest approach and works well when your rubric levels are already designed to map cleanly to percentages. In our example, 12 out of 16 gives 75 percent, which maps to a C.
Method B: Performance-level averaging. Convert each criterion score to its performance-level percentage, then average them. For our student: claim at 85 percent, evidence at 95 percent, organization at 85 percent, conventions at 70 percent. The average is 83.75 percent, which rounds to 84 percent and maps to a B. This method rewards students for meeting expectations rather than penalizing them for not exceeding on every criterion.
I have found Method B produces grades that feel more accurate to the quality of work. It also aligns with the principle that meeting expectations should result in a respectable grade, not a barely-passing one.
Step 6: Map to Your Letter Grade Scale
Once you have your percentage, map it to your school’s grading scale. Most schools use a variation of this standard scale:
- A equals 90 to 100 percent
- B equals 80 to 89 percent
- C equals 70 to 79 percent
- D equals 60 to 69 percent
- F equals below 60 percent
Some schools include plus and minus grades. In a plus/minus system, 87 to 89 percent is a B+, 83 to 86 percent is a B, and 80 to 82 percent is a B-. Always check your school’s specific scale rather than assuming.
Using Method B from our example, the student’s 84 percent maps to a B. Using Method A, the 75 percent maps to a C. Same rubric, same student work, very different outcomes. This is why choosing your conversion method deliberately matters so much.
Step 7: Round Consistently and Record
Decide on a rounding rule and apply it uniformly. I recommend rounding to the nearest whole number for gradebook entry. A score of 83.5 becomes 84, and a score of 82.4 becomes 82.
Document your conversion method so you can explain it to students, parents, and administrators. Transparency builds trust and reduces grade disputes. When someone asks why a student earned a B instead of a C, you can walk them through the exact calculation.
Three Guiding Principles for Fair Rubric Grading
Beyond the mechanics, fair rubric grading rests on three principles that should guide every conversion decision you make.
Principle 1: Meeting Expectations Should Not Equal Failure
If a student meets the expectations you set, they should not receive a failing or near-failing grade. This sounds obvious, but it happens constantly when teachers treat rubric levels as raw points without conversion. On a 4-point rubric scored as raw points, meeting expectations on every criterion gives 3 out of 4, or 75 percent, which is a C.
A student who meets every expectation has demonstrated competence. A C grade sends the message that their work is barely adequate, which contradicts the rubric’s own descriptors. Map meeting expectations to at least an 80 percent to maintain alignment between your rubric language and your grades.
Principle 2: Reward Students Who Exceed Expectations
Students who go beyond the standard should see that reflected in their grade. If exceeding expectations maps to 95 percent, the gradebook should show it. Some teachers compress the top of the scale so that both meeting and exceeding expectations land in the B range, which removes the incentive to excel.
Make sure your conversion creates meaningful separation between performance levels. If Level 3 gives 85 percent and Level 4 gives 90 percent, that 5-point difference is noticeable and motivating. If the gap is only 2 points, students may not feel the effort to exceed is worth it.
Principle 3: All Criteria Do Not Weigh Equally
Not every rubric criterion deserves the same influence on the final grade. In a science lab report, the methodology and data analysis matter more than formatting. In a creative writing piece, voice and ideas carry more weight than mechanics. Your conversion should reflect these priorities through weighting.
Weighting can be as simple as assigning more points to important criteria. If evidence and support are worth 8 points while conventions are worth 4, a student’s performance on evidence has twice the impact on their final score. I cover specific weighting methods in detail later in this guide.
Rubric Conversion Charts for Every Scale
One of the biggest gaps in existing resources is a single, comprehensive conversion chart covering the most common rubric scales. Below you will find percentage mappings for 3-point, 4-point, 5-point, and 6-point rubrics. These charts use the principle that meeting expectations equals approximately 85 percent, with appropriate spacing above and below.
4-Point Rubric Conversion Chart
The 4-point rubric is the most widely used format in K-12 education. Here is a recommended percentage mapping:
- Level 4 (Exceeds): 95 to 100 percent
- Level 3 (Meets): 85 percent
- Level 2 (Approaching): 70 percent
- Level 1 (Beginning): 55 percent
- Level 0 (No evidence): 0 to 40 percent
To convert multi-criteria scores, assign each criterion its percentage based on the level earned, then average across all criteria. This produces a fair composite score that reflects the student’s overall performance profile.
3-Point Rubric Conversion Chart
Three-point rubrics are simpler and work well for younger students or focused assessments. The mapping compresses the range:
- Level 3 (Exceeds): 95 to 100 percent
- Level 2 (Meets): 82 percent
- Level 1 (Not yet): 60 percent
With only three levels, each jump represents a significant difference in performance. The gap between meeting and not-yet is intentionally large to reflect that a student who has not met the standard has substantial work to do.
5-Point Rubric Conversion Chart
Five-point rubrics offer more granularity. They are common in middle school and high school where finer distinctions matter. Here is a recommended mapping:
- Level 5 (Exceeds): 97 to 100 percent
- Level 4 (Proficient): 88 percent
- Level 3 (Developing): 78 percent
- Level 2 (Emerging): 68 percent
- Level 1 (Beginning): 55 percent
The 5-point scale gives room for a middle “developing” level that sits between meeting and not meeting expectations. This is helpful for formative assessments where students are still building skills.
6-Point Rubric Conversion Chart
Six-point rubrics are popular in writing assessment, especially with 6-Traits frameworks. The wider scale allows for nuanced evaluation. Here is a percentage mapping designed for 6-point holistic scoring:
- Level 6: 97 to 100 percent (A)
- Level 5: 90 percent (A-)
- Level 4: 83 percent (B)
- Level 3: 75 percent (C)
- Level 2: 65 percent (D)
- Level 1: 50 percent (F)
For 6-point rubrics, the middle scores (3 and 4) represent the most common range of student work. Level 3 represents adequate work that meets minimum expectations, while Level 4 represents strong, competent work. The grade difference between these levels is significant, so score carefully.
Percentage to Letter Grade Quick Reference
Once you have your percentage from any rubric scale, map it to a letter grade. Here is the standard 10-point scale used by most schools:
- A: 90 to 100 percent
- B: 80 to 89 percent
- C: 70 to 79 percent
- D: 60 to 69 percent
- F: below 60 percent
For plus and minus grading, split each range into thirds. For example, 90 to 92 equals A-, 93 to 96 equals A, and 97 to 100 equals A+. Adjust based on your school’s specific policy.
How to Weight Rubric Criteria
Weighting is where rubric grading moves from basic to sophisticated. Not all criteria are created equal, and your scoring system should reflect that.
Why Weighting Matters
Imagine a science project rubric with four equally weighted criteria: hypothesis, experimental design, data analysis, and visual presentation. A student could score perfectly on presentation but poorly on data analysis and still earn a B. That grade misrepresents their scientific understanding.
Weighting solves this by giving more important criteria a larger share of the total points. Data analysis might be worth 40 percent of the grade while presentation is worth 10 percent. The student who excels at posters but struggles with analysis sees that reflected accurately.
Teachers on forums frequently ask how to weight traits when using frameworks like 6-Traits Writing. The answer is that it depends on your instructional priorities. If you are teaching a unit on organization, weight that trait more heavily. If conventions are the focus, increase their value. Make the weighting match your learning goals.
Step-by-Step Weighted Scoring Example
Let me show you exactly how weighted scoring works with real numbers. Suppose you have a project rubric with three criteria and the following weights:
- Content knowledge: 50 percent of the grade
- Application and analysis: 35 percent of the grade
- Presentation quality: 15 percent of the grade
Each criterion is scored on a 4-point scale, which you convert to a percentage using the 4-point chart from earlier. Now imagine a student scores as follows:
- Content knowledge: Level 3 (Meets) equals 85 percent
- Application and analysis: Level 4 (Exceeds) equals 95 percent
- Presentation quality: Level 2 (Approaching) equals 70 percent
Now multiply each percentage by its weight:
- Content: 85 times 0.50 equals 42.5
- Application: 95 times 0.35 equals 33.25
- Presentation: 70 times 0.15 equals 10.5
Add those weighted scores together: 42.5 plus 33.25 plus 10.5 equals 86.25, which rounds to 86 percent. That is a B, and it accurately reflects a student who is strong in analysis, solid in content, and developing in presentation.
Without weighting, the simple average would be (85 plus 95 plus 70) divided by 3, which equals 83.3 percent. The weighted score of 86 percent is higher because the student performed best on the most heavily weighted criterion. That is exactly how weighting should work.
Common Mistakes Teachers Make When Converting Rubric Scores
After analyzing teacher forum discussions and classroom practices, I have identified the mistakes that most frequently lead to unfair or confusing rubric grades. Avoiding these will immediately improve your grading accuracy.
Mistake 1: Treating Rubric Levels as Raw Points
The number one error is treating a Level 3 on a 4-point scale as 3 out of 4, or 75 percent. As I explained earlier, this penalizes students who meet expectations by giving them a C grade. Always decide what percentage each level represents before you start scoring.
One Reddit teacher described this exact frustration: “The new method is strange to me. They want me to give each category a percentage: Exceeding equals 100 percent, Meeting equals 87 percent, Approaching equals 73 percent.” This teacher was being asked to switch from raw-point thinking to performance-level-percentage thinking, and the transition felt confusing. The effort is worth it because the resulting grades are far more fair.
Mistake 2: Not Weighting Criteria
Earning a Level 4 on formatting should not have the same impact as earning a Level 4 on critical thinking. When every criterion carries the same point value, your grade does not reflect what matters most in the assignment. Take five minutes to assign weights before you grade, and your scores will be more meaningful.
Mistake 3: Inconsistent Rounding
I have seen teachers round 82.5 up to 83 for one student and down to 82 for another. Inconsistency in rounding creates unfairness, even when it is unintentional. Pick a rule (round to the nearest whole number, or always round up, or always round down) and apply it to every student on every assignment.
Mistake 4: Changing the Rubric Mid-Grading
If you realize halfway through grading that your rubric needs adjustments, do not apply the change retroactively to some students and not others. Either re-grade everyone with the updated rubric or note the change for next time. Mid-stream changes are the fastest way to lose student trust.
Mistake 5: Failing to Communicate the Conversion Method
Students and parents deserve to understand how rubric scores become letter grades. If your conversion process is a mystery, you will spend hours answering grade complaints. Share your conversion chart, explain it on back-to-school night, and include it on the rubric itself.
Mistake 6: Ignoring Missing or Incomplete Work
What happens when a student leaves an entire rubric criterion blank? Some teachers assign a zero for that criterion, which can tank the overall grade. Others skip it and average only the completed criteria. Decide your policy in advance, document it, and apply it consistently. I recommend assigning a zero for entirely missing criteria while noting that the student did not attempt that portion of the assignment.
Mistake 7: Relying on Broken Calculator Tools
Multiple teachers on forums have complained that online rubric calculators produce inconsistent or incorrect results. If you use a digital tool, verify its math manually on a few sample scores. Do not trust a tool blindly, especially if it was last updated years ago. The conversion formulas in this guide are simple enough to calculate with a basic spreadsheet or even by hand.
Fairness and Equity in Rubric Grading
Fair grading goes beyond correct math. It requires attention to bias, consistency, and transparency. These considerations matter especially when rubric scores have a significant impact on student grades, placements, or opportunities.
Recognizing and Reducing Rater Bias
Even with a well-designed rubric, the person doing the scoring brings biases. Research on rubric scoring bias, including research on rubric scoring bias by Ilhan, shows that raters can be influenced by factors unrelated to the criteria, such as handwriting quality, prior knowledge of the student, or even the order in which papers are graded.
To reduce bias, try scoring anonymously when possible. Shuffle the order of papers so you are not always grading the same students first or last. If you teach multiple sections, mix submissions across classes. These small changes can make a measurable difference in scoring consistency.
Calibrating With Other Teachers
If multiple teachers grade the same assignment, calibration is essential. Have everyone score the same sample paper using the rubric, then compare results. If one teacher gives a paper all Level 4s and another gives it all Level 3s, you have a calibration problem.
Discuss the discrepancies and agree on what each level looks like in practice. Repeat this process periodically throughout the school year. Calibration sessions take 30 minutes and dramatically improve consistency across classrooms.
Building Transparency Into Your Process
Students should never be surprised by their grade. Share the rubric before the assignment begins. Show students examples of work at each performance level. Explain your conversion method in language they can understand.
When students know exactly what they need to do to earn each grade, they focus on the learning rather than gaming the system. Transparency also means being willing to discuss grades with students who have questions. If you can explain exactly how a rubric score became a letter grade, the conversation stays productive.
Considering Effort Versus Achievement
Rubrics measure achievement against criteria, not effort. A student who works incredibly hard but does not yet demonstrate the skill earns a lower rubric score. This can feel unfair, especially when parents see the effort their child is putting in.
The solution is not to inflate rubric scores to reward effort. Instead, consider separating effort indicators (like work habits grades or participation scores) from achievement grades. Both matter, but they measure different things and should be reported separately. This approach is supported by research on motivation and feedback, including the work of Butler and Nisan, who found that grades can undermine intrinsic motivation when they overshadow specific feedback.
Using Digital Tools and LMS for Rubric Grading
Digital platforms can streamline rubric grading, but each tool handles conversion differently. Here is what to expect from the most common learning management systems.
Google Classroom Rubric Tools
Google Classroom lets you create rubrics with up to 50 criteria and five performance levels per criterion. You can assign point values to each level, and Classroom calculates the total automatically. The conversion to a percentage happens based on the point values you set, so design those values carefully using the principles in this guide.
One limitation: Google Classroom does not support weighted criteria natively. If you need weighting, you will have to adjust point values manually so that more important criteria have higher maximum points.
Canvas SpeedGrader Rubrics
Canvas offers robust rubric tools within its SpeedGrader interface. You can create analytic rubrics with custom point ranges and even use rubrics for grading without showing students the point breakdown. Canvas supports rubric criteria with different point maximums, making weighting straightforward.
Canvas also allows you to adjust individual criterion scores after selecting a performance level. This is useful when a student’s work falls between two levels and you want to fine-tune the score.
Blackboard Rubric Integration
Blackboard’s rubric tool is powerful but can be complex to set up. You can create rubrics with weighted criteria, and Blackboard calculates both the raw score and the weighted total. The Grade Center displays these scores alongside your traditional gradebook entries.
The University of Maryland’s teaching center recommends using Blackboard’s rubric feature to ensure consistency across multiple sections of the same course. The system records which performance level was selected for each criterion, creating a detailed record that supports grade transparency.
Feedback-First Grading: A Round 1 and Round 2 Approach
Before I wrap up, I want to share an approach that several educators have found transformative. It comes from the idea that feedback and grades serve different purposes and should sometimes be separated.
In Round 1, you score the work using the rubric but provide only feedback, no points. Students read your comments, revise their work, and resubmit. In Round 2, you score the revised version and assign the grade.
This approach has several benefits. Students engage with feedback more seriously when it is not attached to a grade. Revision improves learning outcomes. And when the final grade arrives, students understand exactly why they earned it because they have already processed the rubric feedback.
Research by Ruth Butler and Mordecai Nisan found that students who received comments alone showed greater improvement than students who received scores or scores plus comments. Grades tend to draw attention away from the feedback, especially for lower-performing students who may feel discouraged by the number before they read the comments.
You do not have to use this approach for every assignment. Try it for one major project per grading period and see how your students respond. Many teachers report that it transforms classroom culture around assessment.
Handling Special Grading Situations
Not every assignment fits neatly into a standard rubric conversion. Here are solutions for the scenarios teachers ask about most.
When a Student Scores Very Low on Every Criterion
If a student earns Level 1 across the board, the raw percentage is approximately 55 percent. Depending on your grading scale, this might be a low F or a high F. Before recording the grade, check whether the issue is skill-based or compliance-based.
If the student attempted every criterion but genuinely struggles with the content, the grade should stand, and you should provide targeted support. If the student did not attempt significant portions, a zero for the missing work may be more appropriate than a 55 percent for incomplete effort.
When a Student Excels in Some Areas But Fails Others
A student might score Level 4 on creativity but Level 1 on conventions. Without weighting, this averages to Level 2.5, or roughly 77 percent. Is that fair? It depends on your priorities.
If this is a creative writing assignment where voice matters more than mechanics, weight creativity higher and the grade improves. If it is a formal research paper where conventions are critical, weight conventions higher and the grade reflects that priority. Your weighting decisions communicate what matters most about the assignment.
When District Policy Requires Letter Grades But You Use Standards-Based Rubrics
Many districts use standards-based grading rubrics but still require letter grades on report cards. This is the conversion challenge teachers raise most often in forums. The solution is to create a clear mapping document that translates rubric levels to letter grades.
A common approach: Exceeds standards maps to A, Meets standards maps to B, Approaching standards maps to C, and Below standards maps to D or F. Share this mapping with students and parents at the start of the year so there are no surprises when report cards arrive.
FAQs
How to convert a rubric score into a grade?
To convert a rubric score into a grade, add up the points earned across all criteria, divide by the total possible points, and multiply by 100 to get a percentage. Then map that percentage to your school’s letter grade scale (90-100 equals A, 80-89 equals B, 70-79 equals C, 60-69 equals D, below 60 equals F). For fairer results, assign each performance level a percentage value before grading rather than treating levels as raw points.
How to convert standards-based grading to letter grades?
Map each standards-based performance level to a letter grade: Exceeding standards equals A (90-100 percent), Meeting standards equals B (80-89 percent), Approaching standards equals C (70-79 percent), and Below standards equals D or F (below 70 percent). Create this mapping document at the start of the year and share it with students and parents so everyone understands how rubric levels translate to report card grades.
Is 75% a C+ or C?
On a standard 10-point grading scale, 75 percent falls in the C range (70-79 percent). In a plus/minus system, 75 percent is typically a plain C. The exact cutoff varies by school: some place C+ at 77-79 percent, others at 75-77 percent. Always check your school’s specific grading scale for precise plus and minus boundaries.
What is a 4 point rubric grading scale?
A 4-point rubric grading scale uses four performance levels to evaluate each criterion: Level 4 (Exceeds expectations), Level 3 (Meets expectations), Level 2 (Approaching expectations), and Level 1 (Beginning). It is popular because it aligns with standards-based grading, forces a clear decision without a neutral middle option, and maps cleanly to percentage ranges when converted thoughtfully.
Conclusion
Learning how to convert rubric scores into fair letter grades transforms assessment from guesswork into a transparent, consistent process. The key takeaways: decide what each performance level means as a percentage before you start grading, weight your criteria to reflect instructional priorities, and communicate your conversion method openly with students and parents.
Start by choosing one conversion method from this guide, build a simple chart for your rubric scale, and test it on your next assignment. Once you see the difference between raw-point conversion and performance-level conversion, you will never go back to treating rubric levels as simple fractions. Your students will earn grades that truly reflect their work, and you will have a system you can defend with confidence.