
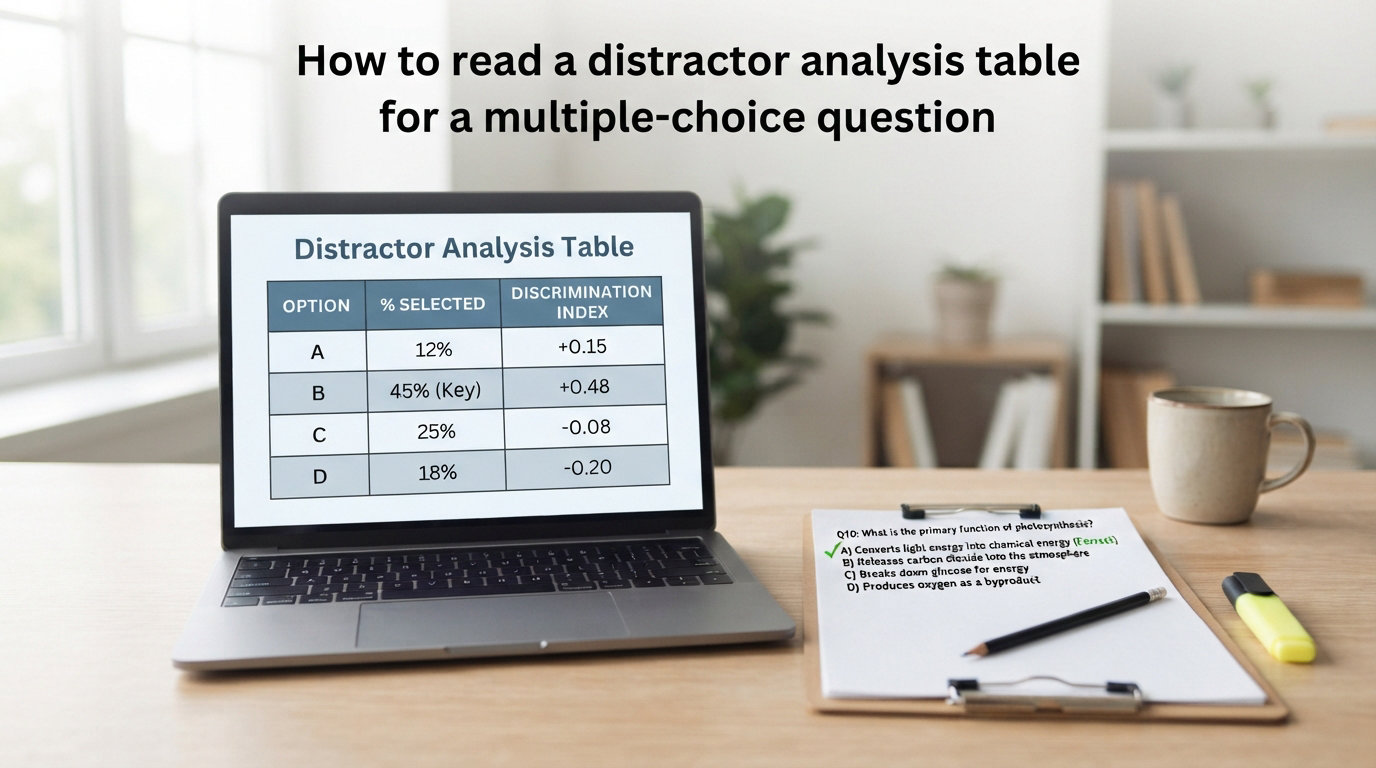
If you have ever administered a multiple-choice exam and wondered whether your questions actually measured what they were supposed to, you are in the right place. Learning how to read a distractor analysis table for a multiple-choice question is one of the most practical skills an educator, test developer, or instructional designer can build. It turns raw test data into clear, actionable feedback about every answer choice on your exam.
A distractor analysis table is a data table that shows how many students selected each answer option on a multiple-choice question, along with performance metrics like the point-biserial correlation, so you can evaluate whether each incorrect choice (distractor) is functioning as intended.
In this guide, I will walk you through every column you are likely to encounter in a distractor analysis table, explain what the numbers mean in plain language, and show you exactly what actions to take when a metric flags a problem. By the end, you will be able to look at any item analysis report and know within seconds whether a question is healthy, needs revision, or should be thrown out entirely.
We will cover the key metrics, a step-by-step reading process, a fully annotated example walkthrough, common mistakes educators make when interpreting these tables, and a practical decision framework for improving your questions based on the data. Whether you are working in K-12, higher education, medical education, or certification testing, the same principles apply.
Table of Contents
What Is a Distractor Analysis Table?
A distractor analysis table is the section of an item analysis report that breaks down how each answer option on a multiple-choice question performed. Instead of just telling you whether students got the question right or wrong, it shows you exactly which wrong answers they picked and whether those wrong answers attracted the right students (low performers) or the wrong ones (high performers).
Before we go further, let me clarify the core term. A distractor is an incorrect but plausible answer choice in a multiple-choice question. The word is sometimes used interchangeably with “foil” or “trap.” A well-written distractor is based on a common student misconception, which means it should look attractive to students who have not yet mastered the material, while students who understand the concept should see right through it.
The distractor analysis table sits inside a broader item analysis report. That report also includes item-level metrics like difficulty (p-value) and discrimination, overall test reliability (such as KR-20), and sometimes visual tools like quantile plots. The distractor analysis table zeroes in on the answer-choice level, giving you the granular detail you need to diagnose problems with individual options.
Our team has found that many educators skip straight past the distractor analysis section because the column headers look intimidating. Terms like “point-biserial correlation” and “proportion selected” can feel like they belong in a statistics textbook rather than a teaching workflow. But once you understand what each column measures, the table becomes one of the most useful diagnostic tools you have.
Think of it this way: the overall item statistics tell you whether a question is healthy at a high level. The distractor analysis table is the X-ray that shows you exactly where the problem is. A question might have acceptable difficulty and discrimination, but when you look at the distractor analysis, you discover one option is completely dead. That level of detail is what makes this table so valuable for iterative question improvement.
Key Metrics in a Distractor Analysis Table
Most distractor analysis tables share a common set of columns. The exact labels vary slightly depending on the platform you use (DataLink, Iteman, Canvas, Brightspace, ExamSoft, and others all format things a little differently), but the underlying metrics are the same. Here is a breakdown of every metric you need to know.
Option Frequency and Proportion Selected
The option frequency column tells you the raw count of students who chose each answer option. The proportion selected column (sometimes labeled “proportion” or “pct”) converts that count into a percentage. Together, these two columns answer the most basic question: did students actually pick this distractor?
If a distractor was selected by zero students (or a very tiny fraction, usually under 5 percent), it is considered a non-functional distractor. Nobody found it plausible enough to choose, which means it is not doing its job of separating students who know the material from those who do not. We will cover what to do about non-functional distractors later in this guide.
On the flip side, if a single distractor is pulling a very high proportion of students (say 40 percent or more), that tells you something important too. It may mean the distractor is exceptionally well-written and targets a widespread misconception, or it may mean the question is too hard and students are guessing. Pair this metric with the discrimination data to tell the difference.
Point-Biserial Correlation
The point-biserial correlation (often abbreviated as rpb or r-pb) measures how well each answer option discriminates between high-scoring and low-scoring students. It ranges from negative values (bad) through zero (neutral) to positive values (good).
For the correct answer, you want a positive point-biserial correlation. This means students who scored well on the overall test were more likely to choose this answer than students who scored poorly. That is exactly what should happen.
For each distractor, you want a negative point-biserial correlation. This means lower-scoring students were more likely to pick this wrong answer, while higher-scoring students avoided it. That is the signature of a well-functioning distractor.
Here is a quick reference for interpreting point-biserial values:
0.30 or higher (correct answer): Excellent discrimination. The question is working well.
0.20 to 0.29 (correct answer): Good. The question is functioning acceptably.
0.10 to 0.19 (correct answer): Marginal. The question may need review or revision.
Below 0.10 (correct answer): Poor. The question is not discriminating between high and low performers and likely needs attention.
Negative (correct answer): Red flag. Higher-scoring students are choosing wrong answers more often than the keyed correct answer. This often means the answer key is wrong, or the question is fundamentally flawed.
Negative (distractor): This is what you want. Low performers are selecting this distractor more than high performers.
Positive (distractor): Red flag. High performers are selecting this wrong answer, which may indicate a trick question, ambiguous wording, or a second correct answer.
Item Difficulty (P-Value)
The item difficulty index, often called the p-value, is the proportion of students who answered the question correctly. It ranges from 0 to 1. A p-value of 0.75 means 75 percent of students got the item right.
Many educators assume a high p-value (very easy question) is always good and a low p-value (very hard question) is always bad. That is one of the most common misconceptions in test analysis. The p-value alone does not tell you whether a question is good or bad. It tells you how hard the question was. You need to pair it with the discrimination index to determine whether the difficulty level is appropriate.
Here is a general guide for interpreting item difficulty:
0.85 to 0.95: Very easy. Acceptable for foundational or screening items, but watch for ceiling effects.
0.50 to 0.85: Moderate difficulty. This is the ideal range for maximizing discrimination on most exams.
0.30 to 0.50: Difficult. May be appropriate for advanced or mastery-level assessments, but check discrimination closely.
Below 0.30: Very difficult. Most students are getting it wrong. Investigate whether the question or answer key is the problem.
One important nuance: for questions with four or five options, a p-value below 0.25 (for four options) or below 0.20 (for five options) means students are performing worse than random guessing. This almost always signals a flawed question or an incorrect answer key.
Item Discrimination Index
The item discrimination index (sometimes labeled D or r-it) measures how well the overall question separates students who know the material from those who do not. It is typically calculated using the upper-lower group method (comparing the top 27 percent of scorers to the bottom 27 percent) or through the point-biserial correlation for the correct answer.
Here is a standard interpretation guide for the discrimination index:
0.40 or higher: Very good discrimination. The question is excellent.
0.30 to 0.39: Good discrimination. The question is reasonably effective.
0.20 to 0.29: Fair. The question may need revision to improve discrimination.
0.10 to 0.19: Poor. The question is weak and should be revised or replaced.
Below 0.10 or negative: Very poor. The question is not discriminating at all, or worse, it is discriminating in the wrong direction.
The discrimination index and the point-biserial correlation for the correct answer are closely related. Some platforms report both, while others report only one. If your platform reports both and they tell different stories, the point-biserial is generally the more precise metric because it uses data from all students rather than just the top and bottom 27 percent.
Distractor Efficiency
Distractor efficiency is a summary metric that tells you what percentage of your distractors are actually functioning. It is calculated by dividing the number of functional distractors (those selected by at least 5 percent of students) by the total number of distractors.
For example, if a question has three distractors and two of them were selected by students while one was ignored, the distractor efficiency is 67 percent (2 of 3). A distractor efficiency of 100 percent means every distractor is pulling students away from the correct answer. A lower percentage means some distractors are dead weight.
Research by Tarrant, Ware, and Mohammed (2009) suggests that distractor efficiency of at least 67 percent is a reasonable target for classroom assessments. For high-stakes certification or licensure exams, you should aim higher.
How to Read a Distractor Analysis Table (Step-by-Step)
Now that you understand the individual metrics, let me walk you through the actual process of reading a distractor analysis table for a multiple-choice question. Follow these six steps in order every time you review an item analysis report.
Step 1: Identify the Correct Answer and Its Selection Rate
Start by locating the row in the table that corresponds to the correct answer. This is usually marked with an asterisk, a checkmark, or a label like “Key.” Check the proportion selected for this row. That number tells you the item difficulty (p-value). If the correct answer was chosen by 72 percent of students, the p-value is 0.72.
This single number gives you your first signal. A p-value between 0.30 and 0.85 generally means the question is in a reasonable difficulty range. Outside of that range, you need to dig deeper.
Step 2: Check Each Distractor’s Option Frequency
Next, move down the table and look at the proportion selected for each distractor. You are looking for two things: whether anyone is choosing each distractor at all, and how the selections are distributed.
Ideally, the selections should spread across the distractors in a way that reflects common misconceptions. If one distractor is pulling 30 percent of students and another is pulling zero, you already know the second one is non-functional. If all three distractors are pulling roughly similar proportions (say, 8 percent, 10 percent, and 10 percent), that is generally a sign of well-balanced options.
As a rule of thumb, any distractor selected by fewer than 5 percent of students is considered non-functional. Flag it for revision.
Step 3: Review the Point-Biserial Correlation for Each Option
Now look at the point-biserial column for every row, including both the correct answer and each distractor. For the correct answer, you want a positive value (ideally 0.20 or above). For each distractor, you want a negative value.
This is where the table tells you not just whether students picked a distractor, but which students picked it. A distractor selected by 15 percent of students with a negative point-biserial is doing exactly what it should: attracting lower-performing students. A distractor selected by 15 percent of students with a positive point-biserial is a red flag. It means your higher performers are choosing a wrong answer, which suggests ambiguity, a trick question, or even a second correct answer.
Step 4: Look for Non-Functional Distractors
Combine what you learned in Steps 2 and 3. A non-functional distractor is one that either nobody selects (under 5 percent) or one that shows no meaningful discrimination pattern (point-biserial near zero with very low frequency). These distractors are not contributing to the question’s ability to separate knowledgeable students from unprepared ones.
Non-functional distractors reduce the effective number of options on your question. If a four-option question has two non-functional distractors, students are effectively choosing between two options, which means guessing gives them a 50 percent chance instead of 25 percent. This inflates the p-value and undermines the question’s validity.
Step 5: Check for Negative Discrimination on the Correct Answer
This is the most critical check in the entire process. If the correct answer has a negative point-biserial correlation or a negative discrimination index, your strongest students are getting the question wrong more often than your weakest students. Something is fundamentally broken.
The most common cause is an incorrect answer key. Perhaps you marked option B as correct, but option D is actually the right answer, or the question has two defensible correct answers. Another possibility is that the question wording is so ambiguous that knowledgeable students read it differently and choose a different option. Either way, a negative discrimination on the correct answer demands immediate investigation before you use the question again.
Step 6: Summarize the Item’s Overall Health
After running through Steps 1 through 5, assign the item a health rating. A healthy item has a moderate p-value, strong positive discrimination on the correct answer, negative point-biserials on all distractors, and no non-functional distractors. A borderline item has one or two metrics in the marginal range and may need minor revision. A broken item has negative discrimination, multiple non-functional distractors, or other red flags that require major revision or removal.
This six-step process works regardless of which platform generated your report. Whether you are reading output from DataLink, Iteman, ExamSoft, or a learning management system, the same columns and the same logic apply.
Example: A Complete Distractor Analysis Table Walkthrough
Let me show you how this works with a real example. Imagine you gave a 100-question biology exam to 200 students. Here is the distractor analysis table for Question 14, which asks about cellular respiration.
For this question, option B is the correct answer. Here is what the table shows:
Option A: Selected by 28 percent of students. Point-biserial: minus 0.18.
Option B (correct): Selected by 52 percent of students. Point-biserial: 0.35.
Option C: Selected by 18 percent of students. Point-biserial: minus 0.12.
Option D: Selected by 2 percent of students. Point-biserial: minus 0.02.
Now let me walk you through the interpretation using the six-step process.
Step 1: The correct answer (B) was selected by 52 percent of students. The p-value is 0.52, which falls in the moderate difficulty range. Good start.
Step 2: Option A is pulling 28 percent of students, Option C is pulling 18 percent, and Option D is pulling only 2 percent. Options A and C are clearly functional. Option D is non-functional because it falls below the 5 percent threshold.
Step 3: The correct answer has a point-biserial of 0.35, which indicates good discrimination. Option A has a point-biserial of minus 0.18 (negative, which is what we want for a distractor). Option C has a point-biserial of minus 0.12 (also negative, also good). Option D has a point-biserial of minus 0.02, which is essentially zero, confirming it is not contributing to discrimination.
Step 4: Option D is the non-functional distractor. Nobody finds it plausible. You need to rewrite it.
Step 5: The correct answer has a positive discrimination, so there is no answer-key problem. Higher performers are choosing the correct answer.
Step 6: Overall health assessment. This question is mostly healthy. The correct answer discriminates well, two of three distractors are functional and attracting lower performers, and the difficulty is appropriate. The only issue is the non-functional Option D. You should rewrite Option D to make it more plausible before reusing this question.
This is exactly the kind of analysis you should do for every question after each test administration. It takes about 30 seconds per question once you get comfortable with the process. Multiply that across a 100-question exam, and you have a thorough quality review done in under an hour.
What Makes a Good Distractor (vs. a Bad One?)
A good distractor is plausible enough to attract students who have partial understanding or specific misconceptions, but clearly wrong to students who have mastered the material. A bad distractor is either so obviously wrong that nobody picks it, or so ambiguous that high performers choose it over the keyed correct answer.
Here are the characteristics of a well-functioning distractor:
Based on a real misconception: It reflects a common error students make when they partially understand the topic.
Selected by a meaningful proportion: At least 5 percent of students choose it, and ideally more than 10 percent.
Attracts lower performers: Its point-biserial correlation is negative, confirming that low-scoring students pick it more often than high-scoring students.
Parallel in structure: It matches the grammatical form, length, and style of the correct answer so it does not stand out as obviously different.
Not partially correct: It is unambiguously wrong. There is no defensible argument that it could be right under certain interpretations.
Here are the red flags of a bad distractor:
Non-functional: Selected by fewer than 5 percent of students. It is not fooling anyone.
Positive discrimination: High performers are choosing it, which suggests the distractor might actually be correct or the question is ambiguous.
“All of the above” or “None of the above”: These options tend to function poorly and are generally discouraged in modern assessment design.
Too extreme: Options with words like “always,” “never,” or “only” are easily eliminated by test-savvy students.
Inconsistent format: If one option is noticeably longer or shorter than the others, students can eliminate it based on appearance alone.
How Many Distractors Should Be in a Multiple-Choice Item?
Research by Haladyna and Downing (2002) suggests that three options (one correct answer plus two distractors) is often sufficient for most assessment contexts. While four or five options were standard for decades, studies have shown that adding a fourth and fifth distractor rarely improves discrimination. Those extra options frequently end up non-functional.
If you use four options, all three distractors should be functional. If your distractor analysis shows that one or two are consistently non-functional, consider switching to a three-option format. You will save writing time without sacrificing assessment quality.
Distractor Analysis Table vs. Full Item Analysis Report
It is worth clarifying the relationship between a distractor analysis table and the full item analysis report, because the two are often confused. The distractor analysis table is one component of a larger report that contains several layers of data.
The full item analysis report typically includes three tiers of information. The first tier is the item-level summary, which gives you the overall p-value and discrimination index for each question. This tells you whether the question is working at a macro level. The second tier is the distractor analysis table, which breaks each question down by answer option. This is where you see the option frequencies, point-biserial correlations, and proportion-selected data for each choice. The third tier is the test-level summary, which includes reliability coefficients like KR-20 and Cronbach’s alpha, along with summary statistics like mean score and standard deviation.
The distractor analysis table is where the diagnostic detail lives. While the item-level summary tells you whether a question is healthy overall, the distractor analysis tells you exactly which option is causing the problem. That is why learning to read this specific table matters so much for practical question improvement.
Common Mistakes When Reading Distractor Analysis Tables
After working with educators across K-12, higher education, and certification contexts, our team has seen the same interpretive mistakes repeat themselves. Here are the most common ones and how to avoid them.
Mistake 1: Confusing Difficulty with Quality
A low p-value (hard question) does not automatically mean the question is bad, and a high p-value (easy question) does not automatically mean it is good. A question can be very difficult and still be excellent if it discriminates well. Always pair the p-value with the discrimination index before making a judgment about quality.
I have seen professors discard good, challenging questions because the p-value was 0.40, only to realize later that the question had strong positive discrimination. Those difficult questions were doing exactly what they were designed to do: separating students who truly understood the material from those who did not.
Mistake 2: Ignoring the Correct Answer’s Discrimination
Many educators focus exclusively on the distractors and forget to check whether the correct answer itself has a healthy positive discrimination. If the correct answer has a near-zero or negative point-biserial, the question is broken regardless of how well the distractors are written. Always check the correct answer row first.
Mistake 3: Removing a Distractor Without Replacing It
When you find a non-functional distractor, the temptation is to simply delete it. But if you remove a distractor without replacing it, you reduce the number of options, which increases the probability of guessing correctly. If you started with four options and remove one, students now have a 33 percent chance of guessing instead of 25 percent. Always replace a bad distractor with a better one rather than just deleting it.
Mistake 4: Over-Relying on Gut Feeling
One Quora user, a professor, put it well: “My impression of how easy a test is does not correlate well with my students’ impressions.” Educators consistently overestimate how easy their questions are and underestimate how confusing their distractors can be. The distractor analysis table exists precisely to replace gut feeling with data. Use it.
Mistake 5: Flagging a Trick Question as a Good Discriminator
Sometimes a distractor has a positive point-biserial, meaning high performers are choosing it. Some educators interpret this as the question being a “good discriminator” because it separates students. In reality, a positive point-biserial on a distractor usually means the question is ambiguous or poorly worded. Do not celebrate this pattern. Investigate it.
Using Distractor Analysis to Improve Your Multiple-Choice Questions
Reading the table is only half the job. Once you have identified problems, you need to take action. Here is a practical decision framework for common scenarios you will encounter.
When to Revise vs. When to Discard
Not every problematic question needs to be thrown out. Use these guidelines:
Revise if: The question has good discrimination and moderate difficulty, but one distractor is non-functional. Rewrite the bad distractor and keep the rest.
Revise if: The question is slightly too easy or too hard but still discriminates. Adjust the distractors or the stem.
Discard if: The correct answer has negative discrimination. This signals a fundamental flaw that revision alone often cannot fix.
Discard if: Multiple distractors are non-functional and the question has poor discrimination. The item is not salvageable.
Investigate if: A single distractor has a strongly positive point-biserial. This may indicate an answer-key error rather than a bad question.
How to Rewrite a Non-Functional Distractor
If a distractor is non-functional (nobody selects it), the fix is to make it more plausible. Here is a process that works well:
First, identify the misconception the distractor was supposed to target. If the question is about cellular respiration and the non-functional distractor references photosynthesis, ask yourself whether the wording is too obviously wrong. Would a student who is confused about the difference between respiration and photosynthesis actually find this option attractive?
Second, look at the correct answer and identify a closely related but incorrect version of it. For example, if the correct answer is “the mitochondria,” a stronger distractor might reference a related organelle or a common misattribution. The best distractors are one step away from the correct answer, not five steps away.
Third, ensure the rewritten distractor matches the grammatical structure and length of the other options. Students should not be able to eliminate it based on appearance.
Before and After: Revising a Poorly Performing Question
Here is a real-world example from our team’s work with a medical education program. The original question asked students to identify the primary cause of a specific condition. The correct answer was option C. The distractor analysis showed:
Option A: 3 percent selected (non-functional)
Option B: 12 percent selected (functional, negative discrimination)
Option C (correct): 68 percent selected (p-value 0.68, discrimination 0.28)
Option D: 17 percent selected (functional, negative discrimination)
Option A was clearly broken. The original wording for Option A referenced a condition that was so unrelated to the question stem that no student found it plausible. We rewrote it to reference a commonly confused but related condition. After re-administration, the revised question showed:
Option A (revised): 14 percent selected (functional, negative discrimination)
Option B: 11 percent selected (functional, negative discrimination)
Option C (correct): 59 percent selected (p-value 0.59, discrimination 0.38)
Option D: 16 percent selected (functional, negative discrimination)
The p-value dropped from 0.68 to 0.59 (the question became slightly harder because students could no longer eliminate Option A). But more importantly, the discrimination index rose from 0.28 to 0.38. The question went from marginal to strong simply by fixing one distractor.
Building a Red Flags Checklist
Our team recommends creating a simple checklist you can run through after every test administration. Here is a printable version you can adapt:
Does the correct answer have a positive discrimination (0.20 or above)?
Does any distractor have a positive point-biserial? (Investigate immediately.)
Are there any non-functional distractors (under 5 percent selected)?
Is the p-value between 0.30 and 0.85?
Is the overall KR-20 or reliability coefficient at an acceptable level for your context?
Do any items have negative discrimination? (Prioritize these for investigation.)
Are the distractor selections reasonably balanced across functional options?
If you answer “no” or “flagged” to any of these, that item needs attention before it goes back into your question bank.
Platform-Specific Notes: Reading Distractor Analysis in Common Tools
While the underlying metrics are universal, different platforms present the data differently. Here are quick notes on what to expect from some of the most common tools educators use.
DataLink (used widely in K-12 and community college settings) presents distractor analysis in a table format with columns for option letter, frequency, percentage, and point-biserial. The correct answer is typically marked with an asterisk. DataLink reports also include the upper-lower group comparison directly in the distractor table, making it easy to see whether high or low performers selected each option.
Iteman (from Assessment Systems) provides one of the most detailed distractor analysis outputs available. It includes option frequencies, point-biserial correlations, and quantile plots for each option. The quantile plot is a visual representation that shows how each option’s selection rate changes across ability levels, which gives you an immediate visual sense of whether a distractor is functioning.
ExamSoft presents item analysis in a slightly different format, often grouping metrics by category rather than listing every column side by side. The key columns to look for are “proportion selecting each option” and “point-biserial for each option.” ExamSoft also flags items that fall outside acceptable ranges, which can save time on large reports.
Canvas and Brightspace provide basic item analysis through their quiz statistics features. These reports are less detailed than dedicated psychometric software but still show option frequencies and basic discrimination data. If you are working within an LMS and need deeper analysis, you may need to export your data and run the analysis in a dedicated tool.
Regardless of which platform you use, the six-step reading process remains the same. The column labels may differ, but the logic does not change.
FAQs
How to interpret distractor analysis?
To interpret a distractor analysis, check each answer option’s selection rate and point-biserial correlation. The correct answer should have a positive discrimination (0.20 or above), and each distractor should be selected by at least 5 percent of students with a negative point-biserial, meaning it attracts lower-performing students. Flag any distractor selected by under 5 percent as non-functional, and investigate immediately if the correct answer shows negative discrimination.
What is a distractor in multiple choice questions?
A distractor is an incorrect but plausible answer choice in a multiple-choice question. Its purpose is to attract students who have not fully mastered the material while being rejected by students who understand the concept. A well-written distractor is based on a common student misconception and has a negative point-biserial correlation, meaning lower-scoring students choose it more often than higher-scoring students.
How to interpret multiple choice questions?
To interpret multiple choice questions using item analysis, review the item difficulty (p-value), the discrimination index, and the distractor analysis table for each question. A good question has moderate difficulty (p-value between 0.30 and 0.85), positive discrimination (0.20 or above), and functional distractors that attract lower performers. Use these metrics to decide whether to keep, revise, or discard each question.
How many distractors should be in a multiple choice item?
Research suggests that three options total (one correct answer plus two distractors) is often sufficient for effective assessment. While four or five options have been traditional, studies show that fourth and fifth distractors are frequently non-functional. If your distractor analysis shows that one or more options are consistently selected by fewer than 5 percent of students, consider reducing to a three-option format.
Conclusion
Learning how to read a distractor analysis table for a multiple-choice question transforms the way you evaluate assessments. Instead of guessing whether your questions worked, you can look at the data and know. The six-step process I outlined (identify the correct answer, check option frequencies, review point-biserials, flag non-functional distractors, check for negative discrimination, and summarize item health) takes less than a minute per question once you practice it.
The educators who get the most value from this process are the ones who treat it as a routine part of test development rather than a one-time exercise. Every test administration gives you fresh data. Every round of analysis helps you build a stronger, fairer, more discriminating question bank. Start with your next exam, and you will never look at an item analysis report the same way again.