
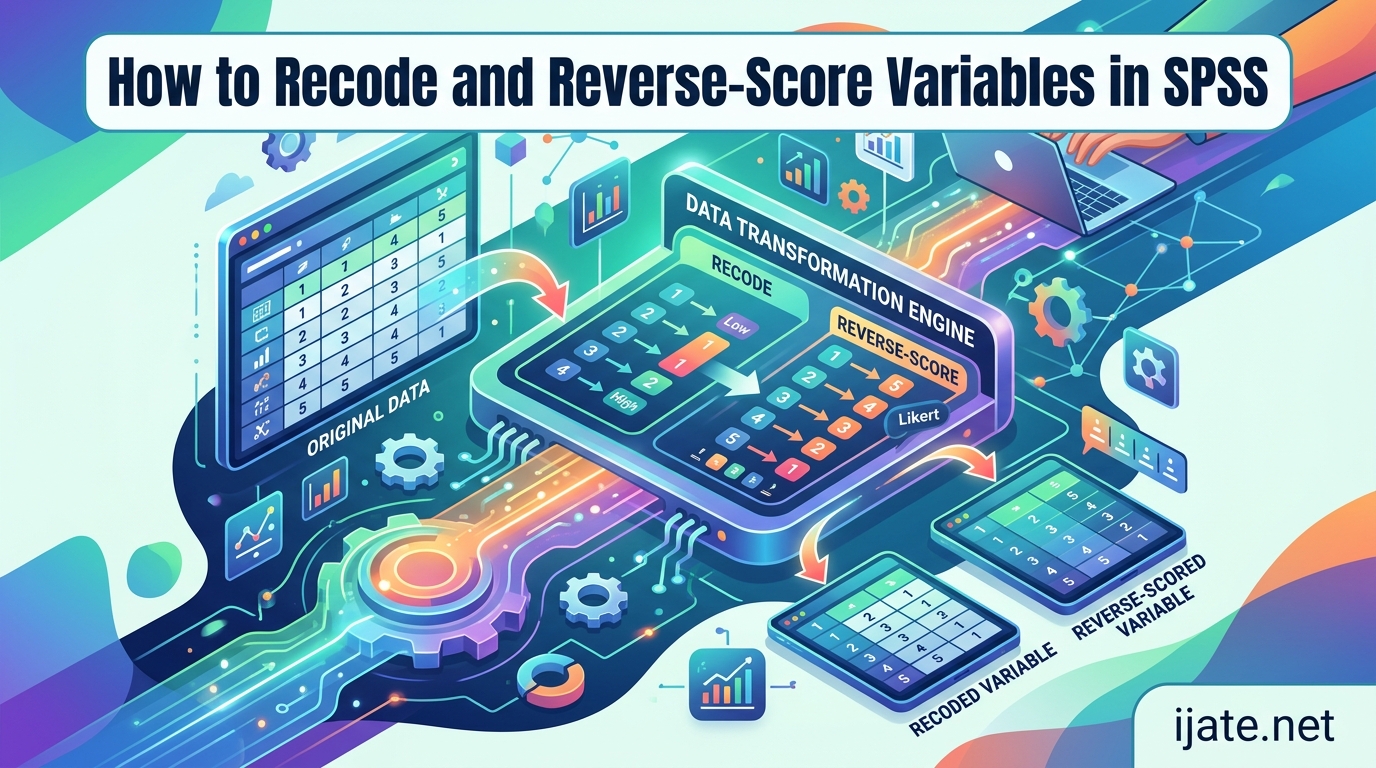
If you have ever run a reliability analysis in SPSS and gotten a Cronbach’s alpha near zero or even negative, missing reverse coding is almost certainly the culprit. Learning how to recode and reverse-score variables in SPSS is one of the most essential skills for anyone working with Likert scale survey data. Whether you are analyzing a dissertation questionnaire, a psychology scale, or a business research instrument, reverse coding ensures that all items measuring the same construct point in the same direction.
I have spent years teaching SPSS workshops and working with graduate students who hit this exact wall. The good news is that reverse coding follows a predictable, repeatable process once you understand the logic behind it. This guide walks through every method available in SPSS, from the point-and-click GUI approach to syntax-based batch processing. I will also cover the common mistakes I see students make every semester, along with troubleshooting tips pulled from real forum discussions.
By the end of this article, you will know exactly which items need reverse coding, how to perform the recoding step by step, how to verify your work, and how to avoid the errors that silently corrupt datasets. Let us start with the quick steps and then dive deep into each method.
Table of Contents
Quick Steps: How to Recode and Reverse-Score Variables in SPSS
Here is the fastest way to reverse-score a variable in SPSS using the GUI. These seven steps assume a standard 5-point Likert scale (1 through 5).
- Open your dataset in the SPSS Data Editor and identify the negatively worded item that needs reverse coding.
- Click Transform > Recode into Different Variables from the top menu bar. Do not choose “Recode into Same Variable” if you want to preserve your original data.
- Select the variable from the left panel and move it into the “Numeric Variable -> Output Variable” box using the arrow button.
- Name the output variable by typing a new name (for example, “Q1R” for the reversed version of Q1) and add a descriptive label, then click Change.
- Click the “Old and New Values” button to open the mapping dialog. For a 5-point scale, set 1 to 5, 2 to 4, 3 to 3, 4 to 2, and 5 to 1. Each mapping gets its own “Add” click.
- Click Continue to return to the main dialog, then click OK to run the recoding.
- Verify the result by running Analyze > Descriptive Statistics > Frequencies on both the original and reversed variables to confirm the values swapped correctly.
That is the entire process at a glance. The sections below explain each step in detail, cover alternative methods, and address the edge cases that trip people up.
Why Reverse Coding Matters in Survey Research
Most questionnaires use a mix of positively worded and negatively worded items to measure the same underlying construct. This technique reduces response bias, where participants simply agree with every statement without reading carefully. For example, an extroversion scale might include “I enjoy being the center of attention” (positively worded) alongside “I prefer to stay in the background at social events” (negatively worded). Both items measure extroversion, but in opposite directions.
The problem arises when you try to combine these items into a single composite score. On a 5-point Likert scale where 5 means “strongly agree,” a high score on the first item indicates high extroversion. But a high score on the second item indicates low extroversion. If you simply average them together without adjustment, the items cancel each other out. Your composite score becomes meaningless noise.
Reverse coding solves this by flipping the values of negatively worded items so that a high score always means the same thing across all items. After reverse coding, a participant who answered “5” on the negatively worded item gets a “1” instead. Now both items align directionally, and your composite score accurately reflects the construct.
I have seen students run Cronbach’s alpha on a scale with un-reversed items and get results like 0.15 or even negative values. They assume the scale is broken. In reality, they just forgot to reverse code two or three items. Once those items are properly reversed, the alpha jumps to 0.80 or higher. This single step can make or break your reliability analysis, factor analysis, and any subsequent statistical tests you run on the data.
Reverse coding also affects correlations. If you correlate an un-reversed negatively worded item with other items in the same scale, the correlation will be negative when it should be positive. This distorts your correlation matrix and can lead to completely wrong conclusions about your data structure.
How to Identify Which Items Need Reverse Coding
This is one of the most common questions I see on the r/spss subreddit. Figuring out which items require reverse coding confuses beginners and experienced researchers alike. The answer comes down to careful reading of your questionnaire items and your scoring manual.
Start by reading each item in your scale and asking a simple question: “Does agreeing with this statement indicate a high level of the construct?” If yes, the item is positively worded and does not need reverse coding. If agreeing with the statement indicates a low level of the construct, the item is negatively worded and needs reverse coding.
For published scales, always check the original scoring guide. The scale developer will typically specify which items are reverse-scored. For example, the Rosenberg Self-Esteem Scale has 10 items, and items 3, 5, 8, 9, and 10 are reverse-scored. The Beck Depression Inventory, the Big Five Inventory, and most validated psychological instruments include explicit reverse-coding instructions in their documentation.
For custom questionnaires you designed yourself, read each item critically. Watch for words like “not,” “rarely,” “never,” “difficult,” “uncomfortable,” or “dislike” as signals that an item may be negatively worded. If you constructed your own scale without a mix of positive and negative items, you may not need reverse coding at all. But if you intentionally included negative items to reduce acquiescence bias, identify them before proceeding.
One practical tip from my workshop experience: create a spreadsheet listing every item in your scale with a column marked “direction” (positive or negative). This becomes your reference document throughout the analysis process and makes it easy to verify you have reversed every item that needs it.
Recode Into Same Variable vs Different Variables: Which Should You Use?
SPSS offers two recoding options under the Transform menu, and choosing the wrong one causes real problems. Here is how they differ and which one I recommend.
Recode into Same Variable overwrites your original values directly. If your original variable Q1 had values of 1, 2, 3, 4, 5, after recoding, those values are permanently replaced with 5, 4, 3, 2, 1. There is no undo once you save and close the file. This is risky because you lose the ability to verify your work or recover from mistakes.
Recode into Different Variables creates a brand new variable containing the reversed values. Your original variable stays untouched. You can compare the original and reversed variables side by side to confirm the coding worked correctly. If something goes wrong, you simply delete the new variable and start over.
I strongly recommend using Recode into Different Variables for all reverse coding tasks. The safety of preserving your original data far outweighs the minor convenience of overwriting in place. Many Reddit users have reported losing original data because they used “Same Variable” and later realized they made an error. There is no reason to take that risk.
One naming convention I use and recommend: add an “R” suffix to reversed variable names. If the original variable is “Q3,” name the reversed version “Q3R.” This makes it immediately clear in your dataset which variables have been reverse-coded and which have not.
Step-by-Step: Recode Into Different Variables in SPSS
This section walks through the full GUI procedure in detail. Follow these steps for each negatively worded item in your dataset.
Step 1: Open the Recode Dialog
With your dataset open in SPSS, click Transform in the top menu bar, then select “Recode into Different Variables” from the dropdown list. A dialog box will appear with your variable list on the left and an empty “Numeric Variable -> Output Variable” box in the center.
Step 2: Select the Variable to Reverse Code
Find the negatively worded item you want to reverse in the left panel. Click it to highlight it, then click the arrow button to move it into the center box. The variable name will appear with a question mark where the output name should go.
Step 3: Define the Output Variable
In the “Output Variable” section on the right, type a name for your new reversed variable. Keep it short but descriptive. For example, if the original variable is “Extrav3,” name the reversed version “Extrav3R.” Type a longer descriptive label in the Label field, such as “Extraversion Item 3 (Reverse Coded).” Click the Change button to confirm. The variable name in the center box should now show your mapping.
Step 4: Map Old and New Values
Click the “Old and New Values” button to open the mapping dialog. This is where you tell SPSS exactly how to flip each value. For a standard 5-point Likert scale, you will create five mappings:
- Old Value: 1, New Value: 5, click Add
- Old Value: 2, New Value: 4, click Add
- Old Value: 3, New Value: 3, click Add
- Old Value: 4, New Value: 2, click Add
- Old Value: 5, New Value: 1, click Add
Each mapping appears in the “Old –> New” list box. Double-check that all five mappings are correct before proceeding. A single wrong mapping will corrupt your data silently.
Step 5: Handle Missing Values
If your variable uses system-missing or user-defined missing values, SPSS handles them automatically. System-missing values stay missing in the output variable. However, if you use specific numeric codes for missing data (such as 99 or -1), you need to map those codes to themselves. For example, if 99 means “missing,” set Old Value 99 to New Value 99 and click Add. This prevents SPSS from treating your missing-value code as a real data point and accidentally recoding it.
Step 6: Run the Recoding
Click Continue to return to the main dialog. Review your settings one final time. Click OK to execute the recoding. SPSS will create the new variable and append it to the right side of your dataset in the Data View. The Output window will display the syntax SPSS generated, which you can save for future reference or replication.
Step 7: Update Value Labels
This is a step many people skip, and it causes confusion later. After reverse coding, the value labels on your new variable are inherited from the original but no longer make sense. For example, if value 1 originally meant “Strongly Disagree” and you reverse-coded it to 5, the new variable will still label 5 as “Strongly Disagree,” which is wrong.
To fix this, switch to Variable View in the Data Editor. Find your reversed variable, click the Values cell, and then click the three dots to open the Value Labels dialog. Update each label so it reflects the reversed meaning. For a reversed 5-point Likert scale, the corrected labels should be: 1 = Strongly Agree (originally 5), 2 = Agree (originally 4), 3 = Neutral (stays 3), 4 = Disagree (originally 2), 5 = Strongly Disagree (originally 1).
Reverse Coding Lookup Tables for Common Likert Scales
Use these reference tables to quickly map old values to new values for the most common scale types. Each table shows the complete set of mappings you need to enter in the Old and New Values dialog.
5-Point Likert Scale (1 to 5):
- 1 becomes 5
- 2 becomes 4
- 3 stays 3 (midpoint does not change)
- 4 becomes 2
- 5 becomes 1
7-Point Likert Scale (1 to 7):
- 1 becomes 7
- 2 becomes 6
- 3 becomes 5
- 4 stays 4 (midpoint does not change)
- 5 becomes 3
- 6 becomes 2
- 7 becomes 1
10-Point Scale (1 to 10):
- 1 becomes 10
- 2 becomes 9
- 3 becomes 8
- 4 becomes 7
- 5 becomes 6
- 6 becomes 5
- 7 becomes 4
- 8 becomes 3
- 9 becomes 2
- 10 becomes 1
0-Based Scale (0 to 4):
- 0 becomes 4
- 1 becomes 3
- 2 stays 2 (midpoint does not change)
- 3 becomes 1
- 4 becomes 0
0-to-10 Scale (0 to 10):
- 0 becomes 10
- 1 becomes 9
- 2 becomes 8
- 3 becomes 7
- 4 becomes 6
- 5 stays 5 (midpoint does not change)
- 6 becomes 4
- 7 becomes 3
- 8 becomes 2
- 9 becomes 1
- 10 becomes 0
Notice the pattern: the midpoint always stays the same. Values above the midpoint and below the midpoint swap positions symmetrically. The formula governing all these mappings is covered in the next section.
The Reverse Coding Formula Method (Max + 1 – X)
If you prefer not to enter value-by-value mappings in the GUI dialog, you can use a mathematical formula to reverse code any scale in one step. The formula works for any evenly spaced scale and requires only two pieces of information: the maximum value on your scale and the individual response value.
The formula: New Value = (Maximum Value + 1) – Old Value
For a 5-point scale (maximum = 5), the formula becomes: New Value = 6 – Old Value. Plugging in the values confirms this works: 6 – 1 = 5, 6 – 2 = 4, 6 – 3 = 3, 6 – 4 = 2, 6 – 5 = 1. These are exactly the mappings from the lookup table above.
For a 7-point scale (maximum = 7): New Value = 8 – Old Value. Check: 8 – 1 = 7, 8 – 4 = 4, 8 – 7 = 1. Correct.
For a 0-based scale (0 to 4, maximum = 4): New Value = 5 – Old Value. Check: 5 – 0 = 5. Wait, that gives 5, not 4. For 0-based scales, the formula needs a small adjustment: New Value = Maximum – Old Value. So for a 0-to-4 scale: 4 – 0 = 4, 4 – 1 = 3, 4 – 2 = 2, 4 – 3 = 1, 4 – 4 = 0. That works correctly.
The general rule: if your scale starts at 1, use (Max + 1 – X). If your scale starts at 0, use (Max – X).
You can apply this formula in SPSS using the Compute Variable dialog. Click Transform > Compute Variable. In the “Numeric Expression” box, type the formula using your actual variable name and maximum value. For a 5-point scale variable named Q1, you would type: 6 – Q1. Type a name for the target variable (such as Q1R) in the “Target Variable” box and click OK.
The formula method is fast, works for any scale size, and is easy to replicate across multiple variables. It also eliminates the risk of entering a wrong mapping in the Old and New Values dialog. I use this method for most of my own reverse coding work because it is cleaner and less error-prone than manual mapping.
One important note: the COMPUTE method will assign system-missing to any case where the original variable is missing. This is the correct behavior and handles missing data automatically without any extra configuration.
How to Reverse Code Multiple Variables at Once in SPSS
If your questionnaire has five or six negatively worded items, recoding them one at a time through the GUI is tedious. SPSS syntax lets you batch the entire operation in seconds. This is a technique most competitors do not cover, and it saves significant time on large datasets.
The most efficient approach combines the RECODE command with a list of variables. Here is the syntax for reverse coding three variables (Q3, Q5, Q8) on a 5-point Likert scale into new variables:
RECODE Q3 Q5 Q8 (1=5) (2=4) (3=3) (4=2) (5=1) INTO Q3R Q5R Q8R.
EXECUTE.
The key is listing all input variables before the mapping rules, then listing all output variables after INTO. SPSS applies the same value mappings to every variable in the list. The EXECUTE command tells SPSS to run the recoding immediately.
Alternatively, you can use the COMPUTE formula method for batch reverse coding. This approach is even cleaner:
COMPUTE Q3R = 6 - Q3.
COMPUTE Q5R = 6 - Q5.
COMPUTE Q8R = 6 - Q8.
EXECUTE.
For a 7-point scale, simply change the constant: replace 6 with 8.
You can also use DO REPEAT for even more compact syntax when you have many variables to reverse:
DO REPEAT v = Q3 Q5 Q8 Q10 Q12 / r = Q3R Q5R Q8R Q10R Q12R.
COMPUTE r = 6 - v.
END REPEAT.
EXECUTE.
This handles five variables in just four lines of code. Save this syntax in a .sps file so you can reproduce your entire reverse-coding workflow if needed. Reproducible syntax is also essential for dissertation methodology sections, where reviewers increasingly expect to see the exact data transformation steps.
How to Verify Reverse Coding Worked in SPSS
Never assume your reverse coding worked correctly just because no error message appeared. I always run three verification checks after reverse coding any variable.
Check 1: Frequency Tables
Run Analyze > Descriptive Statistics > Frequencies on both the original and the reversed variable. Compare the frequency counts side by side. The count for value 1 in the original should equal the count for value 5 in the reversed variable. The count for value 2 in the original should equal the count for value 4 in the reversed. The midpoint count should be identical. If the numbers do not mirror each other perfectly, something went wrong.
Check 2: Descriptive Statistics
Run Analyze > Descriptive Statistics > Descriptives on both variables. The mean of the reversed variable should equal (Maximum + 1) minus the mean of the original. For a 5-point scale, if the original mean is 3.45, the reversed mean should be 6 – 3.45 = 2.55. The standard deviation should be identical. If the standard deviations differ, you have a data problem.
Check 3: Correlation Check
Run a correlation between the original variable and the reversed variable. The correlation should be exactly -1.0 (perfect negative correlation). If it is anything else, the reverse coding did not work as intended. This is the single most definitive test.
If any of these checks fail, redo the reverse coding from scratch. Delete the reversed variable, reopen the Recode dialog, and carefully re-enter the value mappings. The most common cause of failed verification is a typo in the Old and New Values mapping.
Troubleshooting: Common Reverse Coding Problems in SPSS
Over years of helping students and researchers, I have encountered the same set of reverse coding problems repeatedly. Here are the most common issues and their solutions, drawn from real forum discussions and support requests.
Problem: “I clicked OK but nothing happened.”
This is the single most reported issue on the r/spss subreddit. You went through the Recode dialog, clicked OK, and the Output window shows syntax, but no new variable appeared in your dataset. The cause is almost always that you clicked OK before clicking the “Change” button in the Output Variable section. Without clicking Change, SPSS does not register the output variable name and silently skips the recoding. Go back, repeat the steps, and make sure you click Change after typing the output variable name and label.
Problem: “The values did not reverse correctly.”
Some values reversed but others did not. This usually means you missed one of the Old and New Value mappings. Open the Old and New Values dialog again and verify that every value from 1 to your scale maximum has a mapping entered in the Old –> New list. A single missing mapping leaves those cases unchanged in the output variable.
Problem: “My missing values got recoded as real data.”
If you use numeric codes like 99 or -1 for missing data, and you did not explicitly map those codes in the Old and New Values dialog, SPSS may treat them as regular values. For example, if 99 means “missing” and you did not map it, the COMPUTE formula method would calculate 6 – 99 = -93, creating an invalid value. Always define missing values in Variable View before recoding, or explicitly map missing-value codes to themselves in the GUI dialog.
Problem: “I have items on different scales (some 1-5, some 1-7) in the same questionnaire.”
This is a common scenario with mixed-format surveys. You cannot apply the same reverse-coding mappings to both scale types. Reverse code each scale type separately using the appropriate mappings. For the 1-5 items, use mappings for a 5-point scale. For the 1-7 items, use mappings for a 7-point scale. If you plan to combine items into a composite score across different scale ranges, you will also need to standardize the items (convert to z-scores) before averaging them.
Problem: “Reverse coding changed my scale mean dramatically.”
A Reddit user reported their mean shifting from 1.13 to 4.72 after reverse coding and wondered if something was wrong. This is actually expected behavior. If most participants rated a negatively worded item low (meaning they disagreed with the negative statement), reverse coding flips those low scores to high scores. A mean of 1.13 on the original becomes 4.87 on the reversed (6 – 1.13). This is exactly what should happen. The reversal is working correctly.
Problem: “My Cronbach’s alpha is still low after reverse coding.”
If alpha remains poor after reverse coding all negatively worded items, the problem lies elsewhere. Check for items with very low item-total correlations, which may need to be dropped from the scale entirely. Also verify that all items truly measure the same construct. Factor analysis can help identify multidimensional scales that should be split into subscales.
Best Practices and Reverse Coding Checklist
Follow this checklist every time you reverse code variables in SPSS. I developed this list over years of working with research datasets, and it catches errors before they propagate into your final analysis.
- Document which items are negatively worded before touching any data
- Always use Recode into Different Variables, never Recode into Same Variable
- Name reversed variables with an “R” suffix (for example, Q3 becomes Q3R)
- Add a descriptive label noting the variable is reverse coded
- Double-check every Old and New Value mapping before clicking OK
- Handle missing value codes explicitly if using numeric codes instead of system-missing
- Update value labels on reversed variables to reflect the flipped direction
- Run frequency tables on original and reversed variables to verify mirroring
- Confirm the correlation between original and reversed variables is -1.0
- Save your SPSS syntax file for reproducibility and dissertation documentation
- Run Cronbach’s alpha after reverse coding to confirm the scale holds together
- Never include both original and reversed versions of an item in the same composite score
That last point deserves special emphasis because it is a surprisingly common error. If you accidentally include both Q3 and Q3R in your scale total, you are double-counting that item with offsetting values. This corrupts your composite score and distorts every subsequent analysis. Always use only the reversed version in scale construction, and remove or ignore the original.
Frequently Asked Questions
How to recode variables in SPSS?
How to score reverse coded items?
How to reverse variables?
How to do inverse transformation in SPSS?
Conclusion
Knowing how to recode and reverse-score variables in SPSS is a foundational skill for accurate survey research and questionnaire analysis. The process is straightforward once you understand the logic: identify negatively worded items, flip their values using either the GUI dialog or the formula method, verify the results with frequency tables and correlations, and then proceed with your reliability and validity analyses. Always preserve your original data by using Recode into Different Variables, update your value labels, and document every step in a syntax file for reproducibility.
Once your reverse coding is complete and verified, your next steps are to compute composite or mean scores for your scale, run reliability analysis using Cronbach’s alpha, and proceed to factor analysis or regression as your research design requires. With properly reverse-coded items, your reliability statistics will reflect the true internal consistency of your instrument, and your results will stand up to methodological scrutiny.