
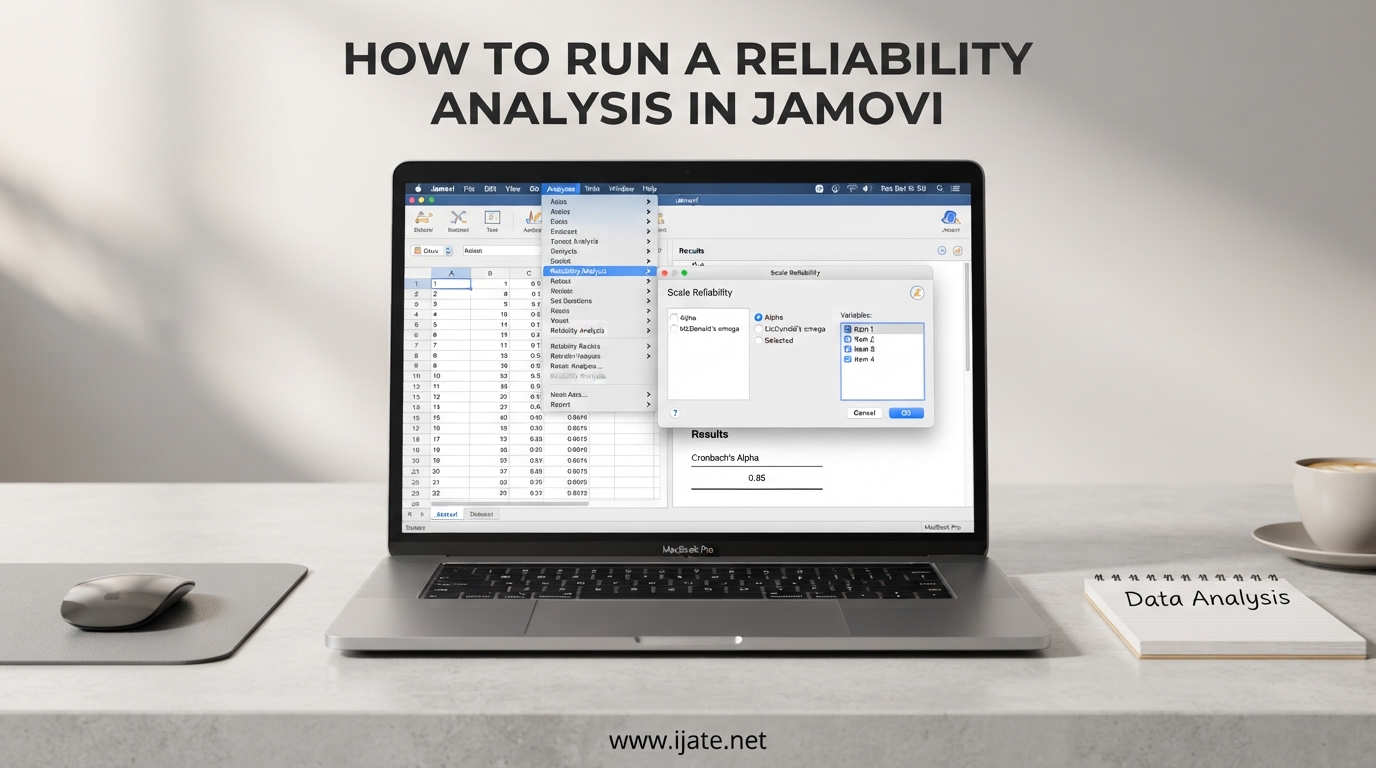
Reliability analysis is one of the first steps any researcher takes when working with multi-item scales. If you have collected survey data with Likert-scale items and want to combine them into a single score, you need to check that those items actually measure the same underlying construct. I have walked dozens of students through this process, and jamovi makes it far more approachable than SPSS ever was. In this guide, I will show you exactly how to run a reliability analysis in jamovi, interpret the output, handle reverse-scored items, and write up your results for publication.
By the end of this tutorial, you will be able to calculate Cronbach’s alpha, explore McDonald’s omega, troubleshoot common errors, and save your scale scores for further analysis. Whether you are an undergraduate student working on your first thesis or a researcher comparing survey instruments, these steps will serve you well.
Table of Contents
What Is Reliability Analysis?
Reliability analysis is a set of statistical techniques used to assess the internal consistency of a group of items. Internal consistency means that all items on a scale are measuring the same underlying construct. If you have a five-item job satisfaction scale, for example, all five questions should correlate highly with each other. If one item does not fit, it may be lowering the overall reliability of your scale.
The most common measure of internal consistency is Cronbach’s alpha. It ranges from 0 to 1, where higher values indicate greater consistency among items. Values above 0.7 are generally considered acceptable in social science research, though the threshold can vary depending on your field and the purpose of your scale. A low alpha signals that some items may not belong together or that your scale is measuring multiple constructs at once.
Running a reliability analysis before using scale scores in further analysis is not just good practice. It is often required by reviewers, supervisors, and journal editors. Without it, you risk reporting findings based on a scale that is not measuring anything coherent.
Prerequisites: Getting Ready for Reliability Analysis
Before running a reliability analysis in jamovi, you need two things: the software itself and your data in the right format. Jamovi is a free, open-source statistical program available for Windows, Mac, and Linux at jamovi.org. Download and install it like any other application. You will not need a license or a student ID.
Your data should be organized in a spreadsheet-style format where each row represents one respondent and each column represents one item from your scale. For a five-item job satisfaction questionnaire, you would have five columns labeled something like Q1, Q2, Q3, Q4, and Q5. All items should use the same response scale, typically a 5-point or 7-point Likert scale.
I have seen many students accidentally import data with the wrong format. Make sure your data is saved as a CSV or Excel file before opening it in jamovi. If you have reverse-scored items, reverse-code them before running the analysis. Jamovi has a reverse-code function, but it is cleaner to handle that step first so your reliability output is easier to interpret.
How to Run a Reliability Analysis in jamovi
This is the main section where I walk through the exact steps. The process takes only a few minutes once your data is ready. I have used this workflow with survey data, personality measures, and classroom evaluation instruments, and it works consistently.
Step 1: Open Your Dataset in jamovi
Launch jamovi and either open an existing dataset or import a new one. Go to the top menu and select Open, then browse to your CSV or Excel file. Jamovi will load your data into a spreadsheet view. Take a moment to confirm that the columns look correct, that variable names are clear, and that there are no unexpected missing values. If you see values coded as text instead of numbers, that is a data type issue you will want to fix before proceeding.
Step 2: Navigate to Analyses > Factor > Reliability Analysis
With your data loaded, look at the top ribbon in jamovi. Click on the Analyses tab, then find the Factor menu option. Inside that menu, click Reliability Analysis. The reliability analysis module lives under Factor in jamovi, which surprises some people who expect it under a more obvious menu like Regression or Descriptives. It is an easy detail to miss.
Once you click Reliability Analysis, a panel will appear on the right side of the window. This is where you will configure your analysis.
Step 3: Select Your Scale Items
In the analysis panel, you will see a list of all variables from your dataset on the left side. Highlight all the items you want to include in your reliability analysis. For a job satisfaction scale with six items, select all six columns. Then click the arrow button to move them into the Variables box on the right. Make sure all your items appear in the Variables field before moving to the next step.
A common mistake here is accidentally including a demographic variable like age or gender in your reliability analysis. Only include the actual scale items that measure the same construct. If your data has a column for participant ID or an overall scale average, leave those out.
Step 4: Configure Options and Run the Analysis
Before you run the analysis, click on the Statistics tab inside the reliability panel. Make sure Cronbach’s alpha is checked, and also check McDonald’s omega if you want that output. Under the Items tab, verify that Alpha if item dropped is enabled. This option shows you how alpha would change if you removed each item from the scale.
Click the run button or simply press Enter. Jamovi will generate results in a panel below your data. You will see scale statistics, item statistics, and a summary table. The whole process typically finishes in under a second for most datasets. If you notice it taking much longer, check the troubleshooting section below.
Interpreting the Results
Once the analysis runs, jamovi displays several tables. The most important one is the scale statistics table at the top. It shows Cronbach’s alpha, McDonald’s omega, and other reliability metrics for your overall scale. Below that, you will find the item statistics table, which includes the alpha value if each item were dropped.
Learning to read these tables takes practice. I will walk you through each part so you know exactly what to report.
Cronbach’s Alpha and Interpretation Guidelines
Cronbach’s alpha is the headline number. A value of 0.7 or higher is widely accepted as indicating acceptable internal consistency. Some fields prefer 0.8 for published research. A value below 0.7 suggests your items are not measuring the same construct well enough to combine them into a single score.
Here is a quick reference table for interpreting alpha values. I have found this scale helpful in my own work and in teaching, because it gives students a concrete benchmark rather than a vague “it depends.”
| Alpha Range | Interpretation | Recommendation |
|---|---|---|
| 0.95 – 1.00 | Excellent | Scale is highly reliable; may indicate item redundancy |
| 0.85 – 0.94 | Very Good | Scale demonstrates strong internal consistency |
| 0.75 – 0.84 | Good | Scale is suitable for most research purposes |
| 0.65 – 0.74 | Acceptable | Usable but consider improving in future research |
| 0.55 – 0.64 | Questionable | Revise scale items before using scores |
| Below 0.55 | Unacceptable | Redesign scale; do not combine items |
Note that very high alpha values, above 0.95, can sometimes indicate that your items are redundant. Two items that are nearly identical in wording will both correlate highly with each other and inflate alpha. This is not necessarily a problem, but it is worth considering whether you need every item on your scale.
Item-Total Statistics and Alpha If Item Dropped
The item-total statistics table is where you identify problematic items. Each row shows one item along with several statistics. The key columns are Cronbach’s alpha if item deleted and item-total correlation. If removing a particular item causes alpha to increase substantially, that item may be weakening your scale. The item-total correlation tells you how well each item correlates with the overall scale score. Values below 0.3 suggest the item is not measuring the same construct as the others.
For example, if your overall alpha is 0.72 and removing Item 4 raises it to 0.78, that is a strong signal that Item 4 should be reconsidered. I have seen scales where removing just one poorly performing item brought alpha from 0.65 up to 0.78, making the scale usable for the original research purpose.
How to Reverse-Code Items
Some scales include reverse-coded items, meaning a higher response indicates a lower level of the construct. A five-item satisfaction scale might have four positively worded items and one negatively worded item like “I am dissatisfied with my job.” If you do not reverse-code that item before running reliability analysis, it will artificially lower your alpha and distort your item-total statistics.
To reverse-code in jamovi, go to the Data tab at the top. Click on the item you want to reverse-code. In the variable properties panel on the right, find the Reverse button and click it. Jamovi will automatically recode the values. For a 5-point scale from 1 to 5, the transformation is: new value = 6 minus original value. So a response of 1 becomes 5, 2 becomes 4, and so on.
Double-check that your reversed item now correlates positively with the other items on the scale. If it still shows a negative correlation in the item-total statistics table, the reverse-coding may not have applied correctly or the item may need to be removed entirely.
McDonald’s Omega: An Alternative to Cronbach’s Alpha
McDonald’s omega is a reliability coefficient that addresses some well-known limitations of Cronbach’s alpha. Alpha assumes that all items have equal loadings on the underlying construct, which is rarely true. Omega accounts for differences in item loadings and often produces a more accurate estimate of reliability, especially for scales with items of varying quality.
The good news is that jamovi calculates McDonald’s omega natively. You do not need to install any additional modules. In the reliability analysis panel, go to the Statistics tab and check the box labeled omegaScale. Jamovi will compute both omega and omega with a confidence interval alongside your Cronbach’s alpha.
In practice, omega values tend to be slightly higher than alpha when items have unequal loadings. A researcher on the jamovi forum shared that a journal reviewer demanded omega after their initial submission was rejected, and calculating it in jamovi resolved the issue in minutes. If you are publishing in a field that values psychometric rigor, reporting omega alongside alpha is becoming increasingly expected.
Common Issues and Troubleshooting
Even with the steps above, things can go wrong. I have compiled the most common issues based on my own experience and what I have seen discussed on the jamovi forum.
Variable type misclassification is the issue I encounter most often. Jamovi sometimes classifies Likert-scale items as nominal instead of ordinal or continuous. When this happens, your variables may appear out of order in the analysis panel, or the analysis may fail to run. To fix this, go to the Data tab, click on the variable, and manually change its type to Ordinal or Continuous under the variable properties on the right. Setting the correct variable type before running the analysis prevents most problems.
Missing data can also cause issues. If any of your items have missing values, jamovi will use listwise deletion by default, meaning any respondent with a missing value on any selected item will be excluded from the analysis. Check the case processing summary in the output to see how many cases were actually used. If you are losing a large number of participants to missing data, consider whether you need a different approach to handling those gaps.
Long calculation times are another reported issue, particularly for large datasets with many items. One forum user noted that the same analysis completed quickly in SPSS but took much longer in jamovi. If you are working with a very large dataset, try reducing the number of items in a single analysis and running them in batches. Also make sure you are using the latest version of jamovi, as performance improvements are released regularly.
A low alpha value can feel discouraging, but it is not the end of the road. Check whether any items are reverse-coded but not processed, whether any items are measuring a different construct, and whether your scale actually has enough items. A scale with only two or three items will almost always produce a lower alpha than a longer scale, regardless of quality.
How to Save Reliability Results as a New Variable
Jamovi can save your scale scores as a new variable in your dataset, which is useful for subsequent analyses such as regression, t-tests, or ANOVA. In the reliability analysis panel, go to the Save tab. You will see options for saving the mean score, the sum score, or both. The mean score is more common and is appropriate when all items are on the same scale. The sum score preserves the total number of points and is useful when you want to report total scores rather than averages.
You can also save z-scores of the mean or sum if you need standardized values. I generally recommend saving the mean score for most research purposes, as it is easier to interpret and matches the output of many other statistical programs.
Split-Half Reliability in jamovi
Split-half reliability is an alternative to Cronbach’s alpha that divides your scale items into two halves and correlates the two resulting scores. It was historically common before alpha became the standard, but it still has value in certain contexts. Jamovi includes a split-half option within the reliability analysis module.
To use split-half reliability, go to the Statistics tab in the reliability analysis panel and check the Split-Half option. Jamovi will report a correlation between the two halves of your scale. The main limitation is that the result depends on how the items are split. Random splits can produce different results each time. For this reason, split-half reliability is typically used as a supplementary measure rather than the primary reliability coefficient.
Writing Up Reliability Results for APA Style
Reporting reliability analysis results in APA 7th edition format is straightforward. Here is a template you can adapt for your own work.
Cronbach’s alpha was calculated to assess the internal consistency reliability of the [scale name]. The [number]-item scale demonstrated [acceptable / good / excellent] internal consistency, with Cronbach’s alpha of [value], 95% CI [[lower], [upper]], and McDonald’s omega of [value]. Item-total correlations ranged from [lowest] to [highest], with [one / no] item falling below the recommended threshold of 0.30. Item [number] (“[item text]”) was removed due to a low item-total correlation, which increased alpha to [new alpha value].
Keep the write-up concise and factual. Report alpha, omega, the confidence interval, and the number of items after any removals. If you removed items, explain your reasoning. Reviewers appreciate transparency about how you arrived at your final scale.
Frequently Asked Questions
How do I run a reliability analysis in jamovi?
Open your dataset in jamovi, go to Analyses u0026gt; Factor u0026gt; Reliability Analysis, select all your scale items by moving them into the Variables box, click on the Statistics tab to ensure Cronbach’s alpha is checked, and the results will appear automatically. The entire process takes under a minute for most datasets.
What is a good Cronbach’s alpha value in jamovi?
A Cronbach’s alpha of 0.70 or higher is generally considered acceptable for research purposes. Values between 0.80 and 0.90 are very good, and values above 0.90 indicate excellent internal consistency. However, values above 0.95 may suggest item redundancy, meaning some items are too similar to each other.
How do I calculate McDonald’s omega in jamovi?
McDonald’s omega is calculated automatically alongside Cronbach’s alpha in jamovi’s reliability analysis module. Go to Analyses u0026gt; Factor u0026gt; Reliability Analysis, then open the Statistics tab and check the omegaScale option. Jamovi will report omega along with its confidence interval in the results output.
How do I reverse-code items before running a reliability analysis?
Go to the Data tab in jamovi, click on the variable you want to reverse-code, and use the Reverse button in the variable properties panel on the right. For a 5-point scale, this transforms values so that 1 becomes 5, 2 becomes 4, and so on. Reverse-coding before running reliability analysis ensures your item-total statistics are calculated correctly.
Why is my Cronbach’s alpha so low in jamovi?
A low Cronbach’s alpha typically indicates that your scale items are not measuring the same construct. Check whether you forgot to reverse-code items, whether some items are measuring a different concept, or whether your scale has too few items. You can also review the alpha if item dropped values in the output to identify which specific item is lowering your overall reliability.
Conclusion
Running a reliability analysis in jamovi is one of the most useful skills you can develop as a researcher working with survey data or psychological scales. The process is straightforward: load your data, navigate to Analyses > Factor > Reliability Analysis, select your items, and interpret the output. Cronbach’s alpha gives you a quick snapshot of internal consistency, while McDonald’s omega provides a more nuanced estimate that accounts for item loadings. The alpha if item dropped table is your best tool for identifying problematic scale items.
If you are just starting out, I recommend practicing with a well-known scale such as a job satisfaction or personality measure so you can compare your results to published values. Once you are comfortable with the basic workflow, you can explore advanced options like saving scale scores, running split-half reliability, and combining reliability analysis with exploratory factor analysis. Knowing how to run a reliability analysis in jamovi will serve you throughout your research career, from undergraduate projects to published journal articles.