
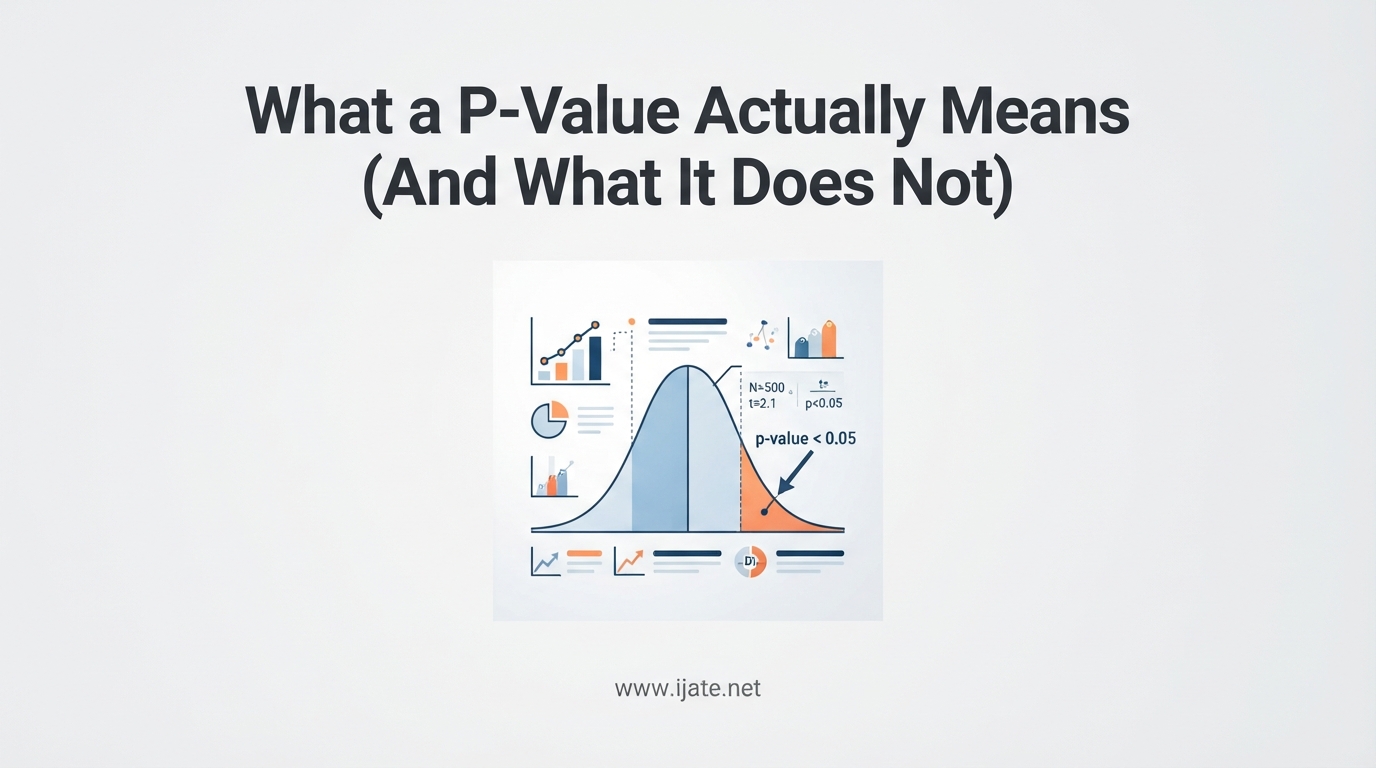
If you have ever read a scientific paper, sat through a statistics class, or skimmed a news article about a medical study, you have probably run into the phrase “p less than 0.05.” Most people memorize the rule, nod along, and move on without truly grasping what that little number represents. Understanding what a p-value actually means matters because misinterpreting one can lead to bad decisions in medicine, business, and public policy. In this guide, we break down what a p-value actually means and what it does not, so you can read research with confidence.
Even researchers who use statistics daily struggle to explain p-values in plain terms, according to discussions across forums like r/statistics and r/AskStatistics. The definition is easy to recite but hard to internalize. Our goal here is to fix that with a jargon-free walkthrough, real examples, and a clear distinction between what a p-value tells you and what people wrongly assume it tells you. You can see how these concepts play out in p-values in educational measurement research published in academic journals.
Table of Contents
What a P-Value Actually Means: A Plain-Language Definition
A p-value is the probability of obtaining results at least as extreme as the ones you observed, assuming the null hypothesis is true. That is the textbook definition, and it is technically correct but unhelpful without unpacking each piece.
Think of it this way. You start every statistical test by assuming nothing interesting is happening. This default assumption is called the null hypothesis. The p-value then asks a simple question: if that boring default were actually true, how surprising would my data be?
A small p-value means your observed data would be quite unlikely under the null hypothesis. A large p-value means your data is consistent with the null hypothesis. That is all a p-value tells you. It is a measure of surprise, not a measure of truth, importance, or effect size.
Here is the one-sentence version worth memorizing: the p-value measures how compatible your data is with the null hypothesis, not how likely the null hypothesis is to be correct. This single distinction separates people who understand statistics from those who merely use it.
The Null Hypothesis: Your Starting Assumption
Every p-value depends on a null hypothesis, so you cannot interpret one without understanding the other. The null hypothesis is the “no effect, no difference, nothing to see here” baseline that you tentatively accept unless evidence pushes you away.
For example, if you are testing a new medication, the null hypothesis states the drug has no effect compared to a placebo. If you are comparing two marketing campaigns, the null hypothesis says there is no difference in conversion rates. The null hypothesis always represents the default, status-quo position.
Alongside the null hypothesis sits the alternative hypothesis, which is what you actually want to prove. The alternative states there is a real effect, a genuine difference, or a meaningful relationship. Statistical testing works by attempting to reject the null hypothesis in favor of the alternative.
This framework matters because the p-value is calculated entirely under the assumption that the null hypothesis is true. It never directly tests the alternative. It only tells you whether your data is too extreme to comfortably fit under the null.
What a P-Value Tells You: Significance Thresholds
Researchers compare p-values against a predetermined cutoff called the significance level, often written as alpha. The most common alpha value is 0.05, a convention that dates back to Ronald Fisher in the 1920s. If your p-value falls below alpha, you reject the null hypothesis and call the result statistically significant.
Here is a quick guide to common p-value thresholds and their typical interpretation:
- p less than 0.001: Strong evidence against the null hypothesis. Result is considered highly significant.
- p less than 0.01: Strong evidence against the null hypothesis. Widely accepted as significant across disciplines.
- p less than 0.05: Moderate evidence against the null hypothesis. The conventional threshold for statistical significance in most fields.
- p greater than 0.05: Insufficient evidence to reject the null hypothesis. The result is not statistically significant at the 0.05 level.
Notice what these thresholds do and do not say. A p-value of 0.04 does not mean there is a 4 percent chance the null hypothesis is true. It means that if the null hypothesis were true, you would see data this extreme about 4 percent of the time. Those two statements sound similar but are fundamentally different.
The 0.05 cutoff is not a law of nature. It is a convention, and a somewhat arbitrary one. Some fields like particle physics demand p-values below 0.0000003 (the five-sigma standard) before claiming a discovery. Other researchers advocate lowering the default to 0.005 to reduce false positives. The threshold you choose should fit the stakes of your decision.
What a P-Value Does NOT Mean: Common Misconceptions
This is where most people, including experienced practitioners, get tripped up. The phrase “what it does not” in our title exists because the gap between what a p-value tells you and what people think it tells you is enormous. Let us close that gap.
Misconception 1: A P-Value Is the Probability That the Null Hypothesis Is True
This is the single most common error. A p-value of 0.03 does not mean there is a 3 percent chance the null hypothesis is correct. The p-value is calculated assuming the null is already true, so it cannot also estimate the probability of the null being true. That would be circular reasoning.
To estimate the probability that a hypothesis is true, you need Bayesian statistics, which incorporates prior beliefs and updates them with data. Frequentist p-values simply cannot answer that question, no matter how much we wish they could.
Misconception 2: A P-Value Measures the Size or Importance of an Effect
A tiny p-value does not mean a large or important effect. With a big enough sample size, even trivially small differences become statistically significant. A drug that lowers blood pressure by 0.1 mmHg could produce a p-value of 0.0001 if you study 50,000 people, but that finding has no clinical relevance.
This is why statisticians urge researchers to report effect sizes alongside p-values. The effect size tells you how big the difference actually is, while the p-value only tells you whether the difference is unlikely under the null. You need both pieces of information to make a sound decision.
Misconception 3: A Non-Significant P-Value Proves the Null Hypothesis
A p-value above 0.05 does not prove there is no effect. It only means your study did not find sufficient evidence to rule out the null hypothesis. Absence of evidence is not evidence of absence. Your sample may have been too small, your measurements too noisy, or your design too weak to detect a real effect.
Forum discussions on r/statistics highlight this confusion constantly. Researchers conclude “no difference exists” when they should conclude “we failed to detect a difference.” Those are very different statements with very different implications.
Misconception 4: A Significant P-Value Means Your Study Hypothesis Is True
Rejecting the null hypothesis does not confirm your alternative hypothesis. Other explanations remain possible, including study flaws, confounding variables, or pure chance. A significant p-value is a piece of evidence, not definitive proof.
Misconception 5: P-Values Are Reproducible
If you repeat a study with a p-value just below 0.05, the chance of getting another significant result in a replication is much lower than most people expect. P-values near the threshold are notoriously unstable. This fact connects directly to the reproducibility crisis shaking multiple scientific fields.
P-Hacking and the Reproducibility Crisis
The American Statistical Association took the unusual step of issuing a formal statement on p-values in 2016, the first time in its 177-year history it addressed a single statistical practice. The ASA statement warned that p-values are widely misused and misunderstood, contributing to a reproducibility crisis where published findings fail to replicate.
One major culprit is p-hacking, the practice of analyzing data in multiple ways until a significant result surfaces. Researchers might test several outcomes, exclude outliers selectively, or switch between analysis methods until p drops below 0.05. Each choice inflates the false positive rate.
The result is a body of published research littered with findings that do not hold up under replication. Fields from psychology to biomedical research have documented replication rates as low as 36 percent for published studies. This is why understanding what a p-value actually means is not just an academic exercise. It affects which treatments get approved, which policies get adopted, and which claims the public believes.
Practical Examples: P-Values in the Real World
Abstract definitions only go so far. Let us walk through three scenarios that make p-value interpretation concrete.
Example 1: A Clinical Trial. Researchers test a new cholesterol drug against a placebo in 2,000 patients. The treatment group shows a 15 percent reduction in LDL cholesterol with p = 0.002. This means if the drug truly had no effect, seeing a reduction this large or larger would happen only about 2 times in 1,000 by random chance. The result is statistically significant, but the researchers still need to check effect size, side effects, and clinical relevance before declaring the drug worthwhile.
Example 2: An A/B Test. A marketing team tests two landing page designs. Version B shows a 2 percent higher conversion rate with p = 0.18. Because 0.18 is well above 0.05, the team cannot rule out random noise. The right conclusion is not “the designs perform identically” but rather “this test lacked the power to detect a difference of this size.” They might need more traffic or a longer test.
Example 3: A Large Observational Study. A study of 100,000 people finds that eating a specific food is associated with a 1 percent difference in health outcomes with p = 0.001. The result is statistically significant, but a 1 percent difference may be practically meaningless. This example shows why significance and importance are separate concepts.
For a deeper look at how statistical methods apply to real research, you can explore statistical analysis methods used in published academic studies.
How to Interpret a P-Value Correctly: A Simple Framework
Use this five-step framework every time you encounter a p-value in a study, report, or news article.
Step 1: Identify the null hypothesis. What is the “no effect” baseline the test assumes?
Step 2: Check the p-value against the significance level. Is it below the chosen alpha, typically 0.05?
Step 3: Look for the effect size. A significant p-value without an effect size tells you nothing practical.
Step 4: Consider the sample size and study design. Large samples can make tiny effects significant, and poor designs can produce misleading p-values.
Step 5: Remember that one p-value is one piece of evidence. Look for replication, consistency with prior research, and plausible mechanisms before drawing firm conclusions.
This framework will not make you a statistician, but it will make you a smarter consumer of statistical claims. Most misinterpretations happen when people skip steps 3 through 5 and treat the p-value as the final word.
Conclusion: Reading P-Values With Clear Eyes
Understanding what a p-value actually means comes down to one core idea: it measures how surprising your data is under the null hypothesis, nothing more. It does not tell you the probability that your hypothesis is true, the size of your effect, or whether your result matters in practice. By keeping these boundaries clear and using the five-step framework above, you can interpret statistical results accurately and avoid the traps that have fueled the reproducibility crisis. The next time you see “p less than 0.05,” you will know exactly what it says and, just as importantly, what it does not.
FAQs
What does the p-value actually tell you?
A p-value tells you the probability of observing results at least as extreme as your data, assuming the null hypothesis is true. It measures how compatible your data is with the null hypothesis, not how likely the hypothesis is to be correct.
Is p-value more than 0.05 significant or not?
A p-value greater than 0.05 is not considered statistically significant at the conventional 0.05 level. It means there is insufficient evidence to reject the null hypothesis, not that the null hypothesis is proven true.
Why is p-value so confusing?
P-values are confusing because they answer a counterintuitive question. They calculate probability assuming the null hypothesis is true, rather than calculating the probability that the hypothesis itself is true. People naturally want the latter, but p-values only provide the former.
Is p 0.001 statistically significant?
Yes, a p-value of 0.001 is highly statistically significant. It means there is only a 0.1 percent chance of observing data this extreme if the null hypothesis were true. This provides strong evidence against the null hypothesis.