
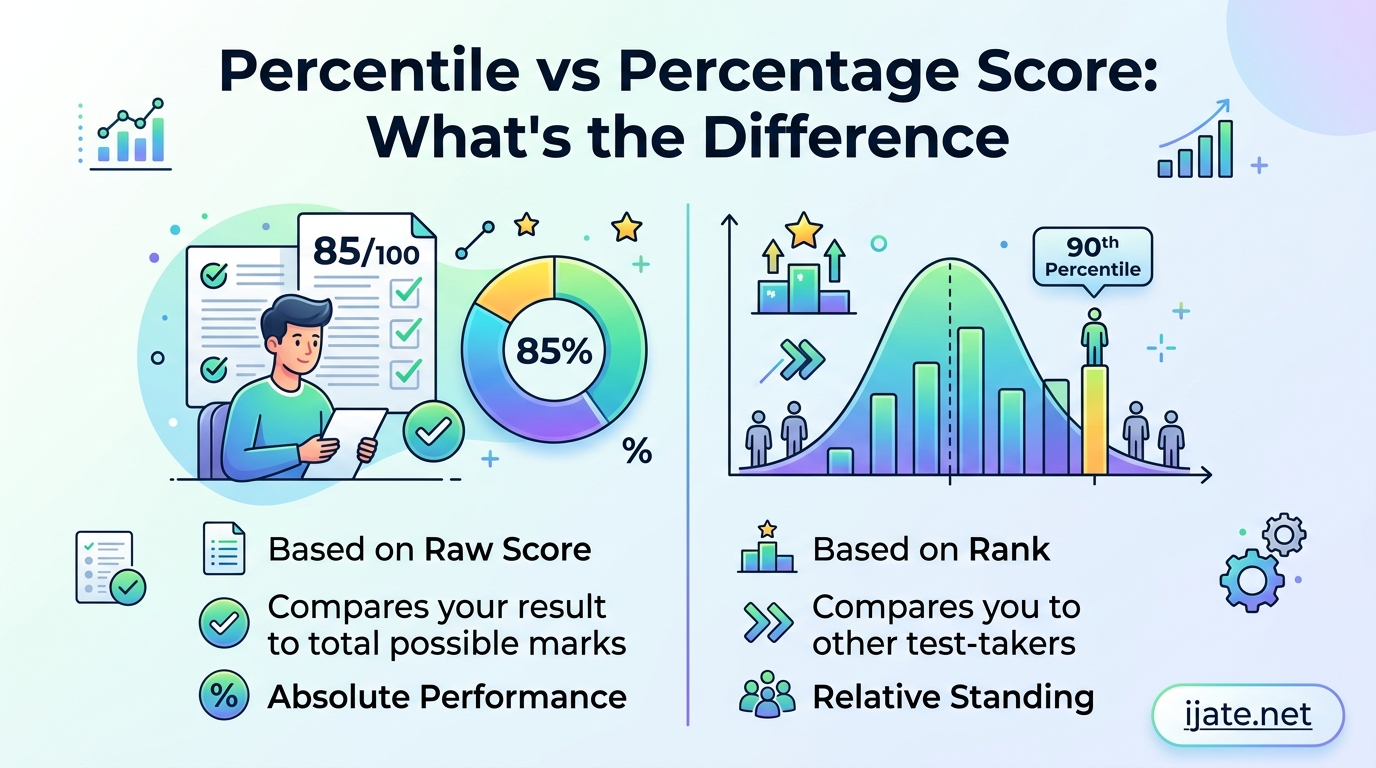
If you have ever looked at a test score, a grade report, or a standardized test result, you have almost certainly encountered both percentages and percentiles. The two terms appear together so often that most people assume they mean roughly the same thing. They do not. A percentage tells you how much of something you achieved out of a total. A percentile tells you how your result compares to other people’s results. Understanding the difference between a percentile and a percentage score matters whether you are interpreting SAT results, evaluating a job candidate’s assessment, or simply trying to make sense of a grade curve. I have seen students, parents, and even experienced professionals misinterpret these numbers in ways that lead to poor decisions. In this guide, I will walk through the definitions, formulas, and real examples that make the distinction clear.
One of the most common sources of confusion I have seen comes from students who score 90% on an exam and assume they are in the 90th percentile. That assumption is almost always wrong. Percentage and percentile measure fundamentally different things. Percentage is about your own performance against a perfect score. Percentile is about your position in a crowd. Mixing them up can lead to completely wrong conclusions about how well you actually performed relative to your peers, and it happens every day on test score reports across the country.
Table of Contents
The Difference Between a Percentile and a Percentage Score
A percentage is an absolute measure — it tells you what portion of the total possible points you earned, expressed as a number out of 100. A percentile is a relative measure — it tells you what percentage of scores in a group fall below a specific value. For example, if 72 out of 100 test-takers scored lower than you, your percentile rank is 72. But if you answered 72 out of 100 questions correctly, your percentage score is 72. The numbers look identical, but they carry entirely different meanings. This single distinction is the key to understanding every test score report you will ever read.
Quick Answer
The core difference: A percentage score measures how much of the total you got right — your score divided by the maximum possible, times 100. A percentile tells you what share of other test-takers scored below you. Percentage is absolute and fixed. Percentile is relative and depends entirely on how the group performs. A student scoring 85% could land anywhere from the 30th to the 99th percentile depending on how hard the exam was and how well the group did.
What Is a Percentage Score?
A percentage score is one of the simplest and most widely used measures in education, business, and everyday life. It expresses a part of a whole as a fraction of 100. The symbol is the percent sign (%). If you answer 45 questions correctly on a test with 50 total questions, your percentage score is 90. The calculation is straightforward: divide the score by the total possible and multiply by 100. This basic formula has been in use for centuries because it standardizes results across different scales. Whether a test has 10 questions or 1,000 questions, the percentage format puts every score on the same 0-to-100 scale.
The formula looks like this:
Percentage = (Score Obtained / Total Possible Score) x 100
Percentages work on a fixed scale from 0 to 100. A score of 0% means nothing was correct. A score of 100% means everything was correct. The result does not depend on how other people performed. If everyone in the class aces the exam, every student can score 100%. If the exam is brutally difficult and everyone fails, the highest score might be 45%. In both cases, each student’s percentage reflects their own raw performance, not how they stack up against classmates. This independence from the group is what makes percentages useful for measuring absolute knowledge or skill.
Percentages appear everywhere in daily life. Teachers use them for grades. Employers use them for performance metrics. Discount tags in stores use them. Loan interest rates use them. The reason percentages are so common is that they give everyone an intuitive sense of scale. Saying “I scored 78%” communicates something clear and immediate. Saying “I answered 39 out of 50 questions correctly” takes longer to interpret. The percentage format standardizes results so people can compare them at a glance across different contexts.
What Is a Percentile?
A percentile is a ranking tool. It tells you what percentage of values in a dataset fall below a specific value. If you score in the 85th percentile on a standardized test, it means 85% of test-takers scored lower than you, and about 15% scored higher. The notation uses the suffix “th” — so we say 85th percentile, 92nd percentile, and so on. Unlike percentages, percentiles do not have a single universal formula. Statisticians use several slightly different methods, and the exact percentile value can vary depending on which method your institution or testing body uses.
The most intuitive way to think about percentile rank is:
Percentile Rank = (Number of Values Below X / Total Number of Values) x 100
Where X is the score you are interested in.
Percentiles only make sense within a specific group or distribution. The 85th percentile on a math exam at a top university means something very different from the 85th percentile on the same exam at a school with a broader student population. This is the crucial insight: your percentile rank depends on the comparison group. Change the group, and your percentile changes — even if your raw score and percentage stay exactly the same.
Statisticians recognize three main definitions of percentile, and the differences between them matter in precise technical work. The first definition says the Pth percentile is the smallest value in the ordered dataset where at least P percent of the data is less than or equal to that value. The second definition says it is the smallest value where strictly less than P percent of the data is below it. The third definition uses a weighted average of values from the first two definitions, a method sometimes called the “linear interpolation” approach. For most practical purposes — reading test score reports, interpreting hiring assessments — the exact method does not change your understanding of the core concept. But it is worth knowing that different organizations calculate percentiles slightly differently, which is why your percentile rank on one test may not translate directly to another platform with the same raw score.
Percentage vs Percentile: Side-by-Side Comparison
The fastest way to internalize the difference is to see both measures laid out across the same set of features. Every dimension in the table below highlights a point where percentage and percentile diverge.
| Feature | Percentage | Percentile |
|---|---|---|
| Definition | A number expressed as a fraction of 100, showing a part of a whole | A value indicating the percentage of scores below a specific point in a dataset |
| Formula | (Score / Total) x 100 | (Count Below / Total Count) x 100 |
| Scale | 0 to 100 | 0 to 100 (as a rank percentage) |
| Notation | Uses the % symbol (e.g., 85%) | Uses “th” suffix (e.g., 85th percentile) |
| Type of Measure | Absolute — based on your own performance alone | Relative — based on your position within a group |
| What It Tells You | How much of the total you achieved | How you rank compared to others |
| Depends on Group? | No — your percentage is independent of others’ scores | Yes — percentile shifts as the comparison group changes |
| Stability Over Time | Fixed — the same raw score always gives the same percentage | Variable — the same raw score can map to different percentiles across test cycles |
| Common Use Cases | Grades, discounts, interest rates, completion rates, batting averages | Test rankings, admissions decisions, hiring assessments, growth charts |
Every row in this comparison table reinforces the same idea: percentage is about you, and percentile is about you versus everyone else. When you receive a score report, the percentage tells you what you got right. The percentile tells you whether that performance was strong or weak relative to the pool of test-takers. Both numbers are useful, but they answer completely different questions. I have watched students focus entirely on their percentage and ignore their percentile, only to be surprised when their seemingly strong score does not stand out in a competitive applicant pool.
How to Calculate Percentage
Calculating a percentage is one of the most basic math skills, and it works the same way in nearly every context. You take the number of points or items you earned, divide it by the total number of points or items available, and multiply the result by 100. The result is a number between 0 and 100 that represents your score as a percentage. This consistency across contexts is what makes percentages such a universal tool.
Step 1: Identify the score you obtained. If you answered 42 questions correctly out of 50, your score is 42.
Step 2: Identify the total possible score. In this example, the total is 50.
Step 3: Divide the obtained score by the total possible score. 42 divided by 50 equals 0.84.
Step 4: Multiply the result by 100. 0.84 times 100 equals 84. Your percentage score is 84%.
This formula works for every scenario. Whether you are calculating a test grade, a discount, a batting average, or a body fat percentage, the structure stays identical. The numbers change, but the logic does not. Percentages are consistent because they rely on a fixed reference point: the total possible. No matter who else takes the same test, your percentage will always be the same as long as your raw score is the same.
How to Calculate Percentile
Calculating a percentile requires a full dataset rather than just two numbers. You need the raw scores of every person in the group you are comparing against. Here is the step-by-step process for finding your percentile rank using the most common method.
Step 1: Gather all scores in the group and arrange them in ascending order, from lowest to highest.
Step 2: Locate your own score within that ordered list.
Step 3: Count how many scores in the list are strictly below your score.
Step 4: Divide that count by the total number of people in the group.
Step 5: Multiply the result by 100 to get your percentile rank.
For example, imagine a class of 30 students takes an exam. You score 78 points. After sorting all 30 scores from lowest to highest, 22 students scored below 78. Your percentile rank is (22 / 30) x 100, which equals 73.3, or approximately the 73rd percentile. This means you scored better than roughly 73% of the class.
It is worth noting that the exact percentile value can shift slightly depending on which statistical definition your testing organization uses. The “nearest rank” method, the “inclusive” method, and the “exclusive” method can all produce slightly different results for the same raw score. These differences are usually small — often just one or two percentile points — but they explain why your percentile on one platform may not match your percentile on another, even with the same raw score. The College Board, the AAMC, and various employment testing platforms each use their own conventions.
Worked Examples Comparing Both
Seeing both measures side by side for the same data is the fastest way to internalize the difference. Let me walk through three examples that show exactly how percentage and percentile diverge in practice.
Example 1: A high school math exam
Thirty students take a 40-question math exam. The results range from 12 correct answers to 38 correct answers. Maria answers 32 questions correctly.
Maria’s percentage score is (32 / 40) x 100 = 80%. This tells us she answered four out of every five questions correctly. It is a solid, objective measure of her knowledge of the material.
To find her percentile, we look at how the full class performed. Out of 30 students, 24 scored below 32 correct answers. Maria’s percentile rank is (24 / 30) x 100 = 80th percentile.
In this case, Maria’s percentage (80%) and her percentile (80th) happen to be close numerically. That is a coincidence. The numbers line up because the exam was reasonably well-calibrated and Maria’s score was near the class median. Change the group or change the exam difficulty, and the alignment disappears entirely.
Now imagine the same exam given to a much more competitive group of 30 students, all honors-level test-takers. Maria still answers 32 out of 40 correctly. Her percentage stays at 80%. But now only 8 students scored below 32. Her percentile rank drops to (8 / 30) x 100 = 27th percentile. Maria’s absolute performance did not change. Her relative standing did, because the comparison group became stronger. This is the clearest demonstration of why percentage and percentile are not interchangeable.
Example 2: SAT reading scores
A student scores 600 out of 800 on the SAT Evidence-Based Reading section. That is a percentage of (600 / 800) x 100 = 75%. The student answered three-quarters of the questions correctly. On its own, 75% sounds like a strong result.
But the College Board reports percentile ranks because they want to show how each test-taker compares to the national pool of recent high school graduates. In a typical year, a 600 on the SAT reading section lands around the 73rd to 75th percentile nationally. The percentile roughly matches the percentage here because the SAT is normed on a large representative sample. If the same student had taken an easier version of the SAT, the raw score-to-percentile mapping would shift entirely.
Example 3: Employee performance assessment
A company gives all 200 sales representatives a product knowledge test scored out of 50 points. James scores 42 out of 50. His percentage is (42 / 50) x 100 = 84%. Out of 200 employees, 30 scored above 42 and 169 scored at or below 42. Using the standard percentile formula with 169 people below him, James’s percentile rank is (169 / 200) x 100 = 84.5th percentile.
In this case, both numbers align again because James scored well above the group average. But if the company hired a more experienced team the following year and James took the same test with a new cohort of 200, his percentage would still be 84%. His percentile, however, could shift significantly depending on how the new group performed. This real-world scenario from corporate hiring shows why HR teams rely on percentile rankings alongside raw percentages when making promotion and placement decisions.
Why Does Your Percentile Change But Your Percentage Does Not?
This is one of the most frequently asked questions on student forums, and it trips up a lot of people. The answer comes down to reference frames. Your percentage is calculated from your own score and the total possible score. Those numbers are fixed. You cannot change how many questions were on the test, and your raw score is a historical fact. So your percentage is permanent.
Your percentile, on the other hand, is calculated from your score and everyone else’s scores. The “everyone else” part is the variable. If you take the MCAT in 2026 and score 515, your percentile might be the 82nd. If you retake in a different testing cycle with a different cohort of test-takers, the same 515 could correspond to a slightly different percentile. Not because your performance changed, but because the group changed. The AAMC re-norms percentiles periodically based on the most recent testing population. That is why your MCAT percentile from three years ago may not match the current percentile for the same raw score.
This dynamic also explains why competitive exams like the JEE and NEET in India report percentiles instead of pure percentages. With hundreds of thousands of test-takers across multiple exam sessions, the goal is to rank everyone fairly even if the exam difficulty shifts from year to year. A percentage alone would not capture that nuance. The percentile adjusts for the group automatically, ensuring that a given score reflects your true competitive standing regardless of whether that particular exam was harder or easier than average.
Common Misconceptions
The internet is full of people who are certain they understand these terms, and then get them wrong in the very next sentence. Let me clear up the most common errors I have encountered in forums, classrooms, and score report discussions.
Misconception 1: The 75th percentile means 75%.
No. The 75th percentile means 75% of the group scored below that value. It says nothing about your raw percentage score. You could score 95% on a test and still be at the 75th percentile if the exam was easy and most people aced it. Conversely, you could score 55% and be at the 75th percentile if the exam was extremely difficult and 75% of the class scored even lower. The percentile describes your rank, not your accuracy.
Misconception 2: The 90th percentile means 90% correct.
This is the single most common mistake I encounter on student forums. The 90th percentile means 90% of the group scored below you. It does not mean you got 90% of questions right. It means roughly 90% of test-takers performed worse than you, and about 10% performed better. You could have answered 60% of questions correctly and still be in the 90th percentile if the test was extremely difficult and 90% of test-takers performed worse than you. Percentile describes rank, not accuracy.
Misconception 3: Percentile rank and percentile are the same thing.
They are closely related but not identical in formal statistical definitions. Percentile rank is a specific value assigned to a data point — for example, the 72nd percentile rank. Percentile can also refer to a cutoff value on a distribution. In everyday use on test score reports, the distinction rarely matters to the reader. But in statistics, the two terms have slightly different formal definitions, and mixing them up in a technical context can cause calculation errors.
Misconception 4: Percentiles can be zero or 100.
This depends on the definition used. Under the strictest mathematical definition, the lowest score in a dataset falls at the 0th percentile and the highest falls at the 100th. But many testing organizations use formulas that prevent exact 0 or 100 values, reporting instead something like the 1st or 99th percentile. The practical takeaway: if you scored the lowest in the group, you are at the bottom of the distribution regardless of whether the report says 0th or 1st percentile. The difference is a rounding convention, not a meaningful change in your standing.
When to Use Percentile vs Percentage
Choosing between these two measures is rarely about which one is “better.” It is about which question you are trying to answer. Use a percentage when you want to know how much of the total material someone mastered. Use a percentile when you want to understand how someone performed relative to a reference group. Both measures have their place, and using the wrong one for your context can mislead your audience.
In education, percentages dominate classroom grading because teachers want to measure what each student knows. A student who answers 90% of questions correctly has demonstrated strong knowledge regardless of how classmates performed. Report cards, homework scores, and classroom quizzes almost always use percentages because the goal is absolute mastery, not competition. Percentiles become more relevant in standardized testing, where the goal is to compare millions of students on a level playing field. The SAT, GRE, MCAT, LSAT, and JEE all report percentiles for this reason.
In hiring, pre-employment assessments often report percentiles. A candidate who scores in the 80th percentile on a cognitive ability test performed better than 80% of the normative sample. The raw percentage of correct answers matters less than the relative standing, because employers are selecting from a competitive pool. A 70% score that puts you in the 95th percentile signals that the test was difficult and you handled it well under pressure. A 95% score that puts you in the 40th percentile signals that the test was easy and many candidates scored high. The percentile reveals what the percentage alone cannot.
In data analysis and statistics, percentiles help you understand distributions without being misled by outliers. The median is the 50th percentile, and it is far more informative about a typical value than the average when the data is skewed. Income data, housing prices, and website response times are classic examples where percentiles reveal what a “normal” value looks like while simple percentages would be meaningless without a defined total. Understanding this distinction is what separates basic data literacy from real statistical competence.
Frequently Asked Questions
Is the 75th percentile the same as 75%?
No. The 75th percentile means 75% of the group scored below that value. It says nothing about your raw percentage score. You could score 95% on a test and still be at the 75th percentile if the exam was easy and most people aced it.
Is the 95th percentile the same as 95%?
No. The 95th percentile means 95% of the comparison group scored below that point. It is a rank, not a raw score. A 95th percentile rank could correspond to a 60% raw score on a very difficult exam or a 98% raw score on an easy one.
Does 90th percentile mean 90% or 10%?
The 90th percentile means 90% of the group scored below that value. It does not mean you got 90% of questions right. It means roughly 90% of test-takers performed worse than you, and about 10% performed better.
Is a percentile better than a percentage?
Neither is universally better. Use percentage when you need to measure absolute performance against a fixed standard. Use percentile when you need to understand relative standing within a group. For classroom grades, percentage is usually more appropriate. For standardized tests and competitive rankings, percentile is more informative.
What is the difference between a percentage and a percentile score?
A percentage score measures how much of the total you achieved, calculated as (score/total) x 100. A percentile measures what share of scores in a group fall below yours. Percentage is absolute and fixed. Percentile is relative and depends on the comparison group.
Can percentile be higher than percentage?
Yes, absolutely. If you score 70% on a very difficult exam where the class average is 50%, your percentile could be the 90th or higher. Percentile reflects your rank within the group, not your raw accuracy, so it can be higher or lower than your percentage score.
What percentile is average?
The average score in any dataset corresponds roughly to the 50th percentile. In a normally distributed set of test scores, the median (which is the 50th percentile) and the mean are nearly identical. Someone at the 50th percentile performed at the exact middle of the group.
The difference between a percentile and a percentage score comes down to one idea: absolute performance versus relative standing. A percentage measures what you achieved against a fixed total. A percentile measures where you stand compared to everyone else. When you look at a test report, check both numbers. The percentage tells you what you know. The percentile tells you how that knowledge stacks up against the crowd. Keeping them separate in your mind will save you from some very common score interpretation mistakes.
If you are preparing for a standardized test like the SAT, GRE, or MCAT, understanding both measures gives you a better picture of where you stand. Your percentage on practice questions tells you which topics to study more. Your percentile on full-length practice exams tells you how competitive your score is. Use them together, and you will get a much clearer read on your actual readiness than either number alone can provide.