
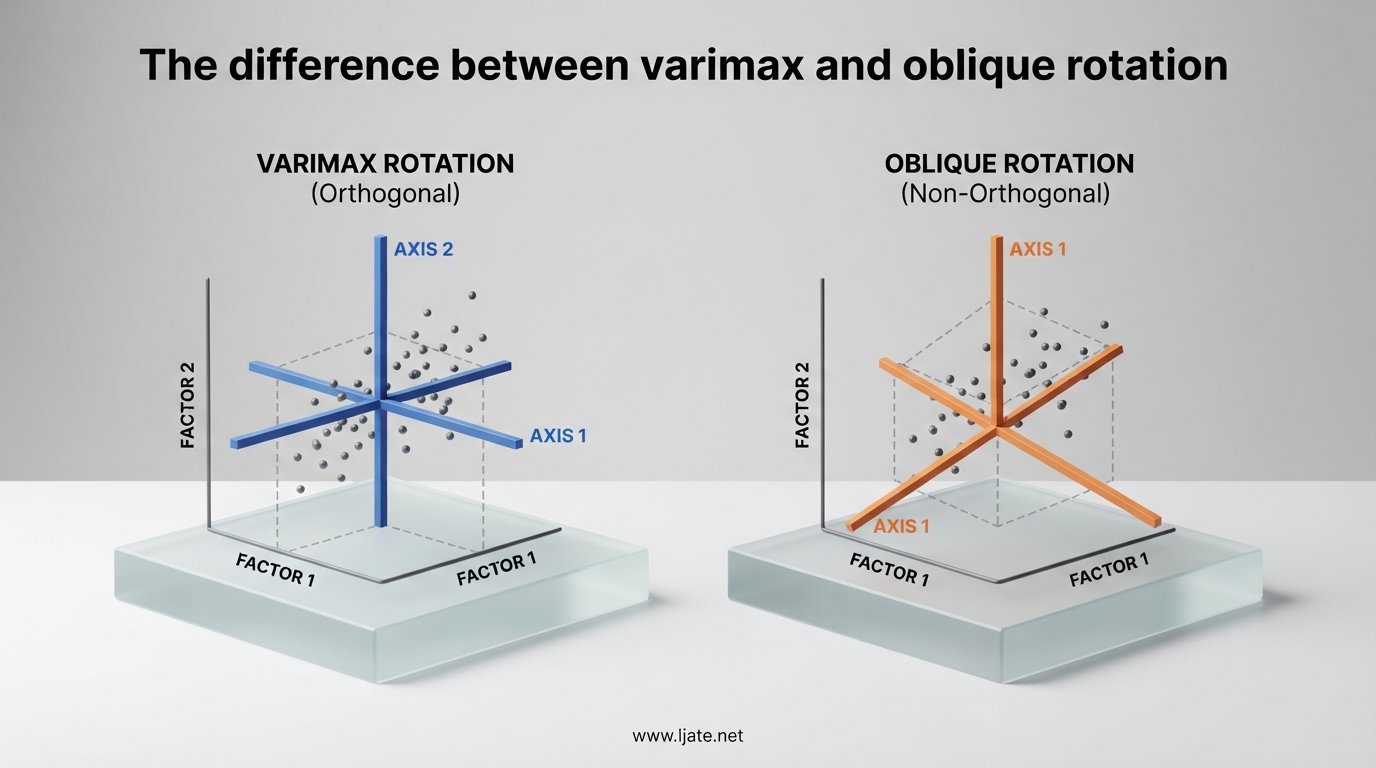
If you have ever stared at SPSS output wondering why your factor solution looks different after switching rotation methods, you are in the right place. The difference between varimax and oblique rotation comes down to one assumption: whether your latent factors are allowed to correlate. That single choice changes how you read the loading matrix, which output table you report, and whether your factors tell a meaningful story.
I have spent years running exploratory factor analysis on questionnaire data, scale validation projects, and survey instruments across psychology and education research. In that time I have seen the same confusion repeat itself: researchers default to varimax because it is the SPSS default, never question the orthogonality assumption, and end up with cross-loadings that disappear the moment they switch to oblique. This guide breaks down exactly what each rotation does, when to use each, and how to interpret the results without second-guessing yourself.
By the end of this article you will understand what factor rotation actually does under the hood, how varimax keeps factors at 90 degrees while oblique rotation lets the axes tilt, why pattern and structure matrices exist, and how to walk through a simple five-step decision process the next time you sit down to run an EFA. Whether you are validating a psychometric scale in R using the psych package or running a default analysis in SPSS, the principles here apply directly.
Table of Contents
The Difference Between Varimax and Oblique Rotation: Quick Answer
Varimax is an orthogonal rotation method that keeps factor axes at a fixed 90-degree angle, which forces the resulting factors to be uncorrelated. Oblique rotation methods, such as promax and direct oblimin, allow the factor axes to tilt away from 90 degrees so the factors can correlate at whatever level the data supports.
That is the entire distinction in one sentence. Everything else, the different output tables, the pattern matrix versus structure matrix split, the cross-loadings that appear or vanish, flows from that single assumption about whether factors are permitted to share variance.
So, is varimax oblique rotation? No. Varimax is the most common orthogonal rotation. Oblique rotation is a separate family that includes promax and oblimin. The two categories are mutually exclusive: a rotation is either orthogonal or oblique, never both.
What Is Factor Rotation and Why It Exists
Before comparing rotation methods, you need to understand what rotation is actually doing. When you run an exploratory factor analysis, the software extracts initial factors using a method like principal axis factoring or maximum likelihood. Those initial factors are mathematically valid but practically useless because every variable tends to load moderately on every factor. The solution is not wrong, it is just rotated in a way that does not align with the natural clusters in your data.
Rotation spins the factor axes through multidimensional space to find a position where each variable loads strongly on one factor and close to zero on the others. Thurstone called this goal “simple structure,” and it is the entire reason rotation exists. Without rotation, your loading matrix is a blur of moderate values that no human can interpret meaningfully.
Think of it like taking a photo of a 3D object. The object itself does not change when you rotate the camera, but certain angles reveal its structure clearly while others hide it. Rotation does the same thing for your factor solution. It does not add or remove information. It simply repositions the axes so the underlying pattern becomes visible.
This leads to one of the most misunderstood facts about rotation: it does not change the model fit. The total variance explained, the communalities, and the reproduction of the correlation matrix are identical before and after rotation. Rotation only redistributes the variance across factors so the loadings are easier to interpret. If you ever hear someone say “oblique rotation fit better than varimax,” that statement is mathematically incorrect. The fit is the same. What changes is interpretability and whether factors are allowed to correlate.
There are two broad families of rotation, and they differ in one fundamental constraint. Orthogonal rotations keep the axes at 90 degrees, which forces factors to be uncorrelated. Oblique rotations relax that constraint, allowing the axes to move closer together or further apart so factors can correlate at any level the data suggests. The rest of this guide explores each family in detail.
PCA vs Factor Analysis: Clearing Up a Common Confusion
Before going deeper into rotation methods, one clarification is essential because it trips up so many beginners. Principal component analysis (PCA) and factor analysis are not the same technique, even though both produce “loadings” and both can be rotated in SPSS using the same dialog box.
PCA is a data reduction technique. It creates linear combinations of your observed variables that capture the maximum variance. Components are mathematical summaries, not latent constructs. Factor analysis, by contrast, assumes that underlying latent factors cause the observed correlations among your variables. The factors exist theoretically, and your observed variables are indicators of them.
The distinction matters for rotation because rotation behaves slightly differently in each context. In factor analysis, rotation is searching for the latent structure that generated your observed correlation matrix. In PCA, rotation is simply redistributing the component variance for easier interpretation. The math of varimax and oblique rotation is the same in both cases, but the interpretation of what your factors represent differs fundamentally.
SPSS makes this confusion worse by offering PCA as the default extraction method inside the Factor Analysis dialog. Many researchers run what they think is factor analysis but is actually PCA. If your goal is to identify latent constructs behind a set of items, switch the extraction method to principal axis factoring or maximum likelihood. Rotation then operates on a true factor solution rather than a component summary, and your choice between varimax and oblique becomes theoretically meaningful.
For the rest of this article, when I talk about rotation I am referring to factor analysis. The rotation concepts apply to PCA as well, but the discussion of pattern versus structure matrices, factor correlations, and construct interpretation only makes full sense in the factor analysis framework.
Varimax: The Orthogonal Default Explained
Varimax is the most widely used rotation method in factor analysis, and it is the default in SPSS for a reason. Developed by Henry Kaiser in 1958, varimax is an orthogonal rotation, which means the factor axes remain perpendicular to each other throughout the rotation process. The angle between any two factors stays locked at 90 degrees, which mathematically guarantees that the factors are uncorrelated.
What varimax specifically optimizes is the variance of squared loadings within each factor. In plain terms, it pushes loadings toward the extremes. Variables that belong to a factor get loadings close to 1.0, while variables that do not belong get loadings close to zero. This produces a clean, easy-to-read loading matrix where each variable tends to cluster neatly under one factor.
That clarity is the main reason varimax became the default. For beginners, for teaching, and for situations where you genuinely believe your constructs are independent, varimax delivers a solution that almost explains itself. You look at the rotated factor matrix, see which variables load above your threshold (commonly 0.40 or 0.32), name the factor based on those variables, and move on.
Beyond varimax, the orthogonal family includes two less common methods. Quartimax minimizes the number of factors needed to explain each variable, which tends to produce a general factor that loads on everything. Equamax is a compromise between varimax and quartimax that balances factor simplicity against variable simplicity. In practice, almost nobody uses quartimax or equamax. Varimax dominates the orthogonal space because it reliably produces the most interpretable solution for typical social science data.
One reason varimax became the historical default is computational. In the 1960s and 1970s, orthogonal rotation was far cheaper to compute than oblique rotation, which mattered when analyses ran on punch-card mainframes. That computational gap has long disappeared, but the default setting persisted in SPSS and other software. Today, there is no computational reason to prefer varimax, only theoretical and practical ones.
When Varimax Is the Right Choice
Varimax makes sense when you have strong theoretical reasons to believe your factors are independent. If you are working with constructs that are conceptually distinct, such as reaction time and verbal ability, forcing them to stay uncorrelated may match your hypothesis. Varimax is also appropriate when simplicity and reproducibility matter more than capturing subtle inter-factor relationships.
Teaching contexts favor varimax because the output is a single loading matrix. There is no factor correlation matrix to explain, no pattern versus structure matrix distinction to untangle, and no judgment call about delta or kappa parameters. Students can focus on learning what factor analysis does without getting lost in oblique-specific output.
Finally, some software workflows and published methodologies simply require orthogonal rotation. If you are following an established protocol in your field that specifies varimax, deviating without justification can complicate peer review. In those cases, varimax is the safe, defensible choice.
Varimax is also useful when you plan to compute factor scores and use them as independent variables in a regression. Because orthogonal factors are uncorrelated, they avoid multicollinearity problems downstream. If your end goal is to derive composite scores for further analysis rather than to interpret the latent structure, the simplicity of orthogonal factors may outweigh the realism of allowing correlations.
The Hidden Cost of Defaulting to Varimax
Here is where most beginners get tripped up. SPSS defaults to varimax, and many researchers never change that setting. But real psychological and educational constructs are rarely independent. Anxiety and depression, reading and math ability, customer satisfaction and loyalty, these constructs overlap by nature. When you force orthogonal constraints on factors that are genuinely correlated, varimax spreads the shared variance across both factors, creating artificial cross-loadings.
I have seen this play out dozens of times. A researcher runs a scale validation, gets messy cross-loadings under varimax, deletes items, reruns the analysis, and still cannot get a clean solution. Switching to oblique rotation reveals that the two factors correlate at 0.55, the cross-loadings vanish, and the factor structure becomes immediately interpretable. The items were never the problem. The rotation assumption was.
The takeaway: varimax is not wrong, but using it by default without questioning whether your factors should be independent is a statistical mistake. Before accepting a varimax solution, ask yourself whether the underlying constructs could plausibly share variance. If the answer is yes, oblique rotation will likely give you a cleaner, more honest picture.
Forum discussions on r/statistics and r/AskStatistics consistently highlight this pattern. Users report that switching from varimax to oblimin routinely resolves cross-loading issues, reduces the number of items that need to be dropped, and produces factor correlations that align with published theory in their field. The software default nudges researchers toward a suboptimal choice, and only those who question it get the better solution.
Oblique Rotation: Promax and Oblimin Explained
Oblique rotation removes the 90-degree constraint. The factor axes are free to tilt toward each other, which allows factors to correlate at whatever level the data supports. This flexibility comes at a small cost in output complexity: oblique rotations produce two loading matrices instead of one, plus a factor correlation matrix. But for most real-world data, the payoff in interpretability is well worth it.
What is oblique rotation in factor analysis? It is any rotation method that permits the extracted factors to be correlated. The two dominant oblique methods are direct oblimin and promax, and they approach the rotation problem from different angles. Both let you control how much correlation is allowed through a tuning parameter.
Direct Oblimin
Direct oblimin, developed by Jennrich and Sampson, is the oblique method most researchers encounter first because it sits right next to varimax in the SPSS rotation dialog. It minimizes the sum of squared loadings weighted by a factor that depends on the delta parameter. When delta is zero (the default), factors are allowed to correlate moderately. Setting delta negative forces factors toward independence, while a positive delta (capped at zero in most implementations) allows higher correlations.
In practice, most analysts leave delta at zero and let the data determine the factor correlations. The result is a solution that often mirrors what varimax would produce but with one key difference: factors that genuinely share variance are allowed to correlate, and the cross-loadings that varimax artificially created tend to shrink or disappear.
Users on statistics forums frequently report that oblimin produces cleaner factor structures when constructs are related. Psychology and education researchers in particular find that oblique rotation reveals meaningful factor correlations, often in the 0.30 to 0.60 range, that confirm theoretical expectations about how latent constructs interrelate.
The delta parameter in direct oblimin deserves a brief explanation because it causes confusion. A delta of zero does not mean zero correlation between factors. It means the algorithm uses its default level of obliqueness. Negative delta values (like negative one) force the solution toward orthogonality, while delta values approaching zero allow moderate correlation. Most published research simply reports “direct oblimin with delta equals zero” and moves on, which is a perfectly defensible default.
Promax
Promax takes a different route to oblique rotation. It starts by computing a varimax solution, then raises the loadings to a power (the kappa parameter, typically 4) to create a target matrix with sharper high-and-low contrast. Finally, it rotates the original solution to match that target as closely as possible while allowing the axes to go oblique.
Because promax builds on varimax, it is computationally fast. That makes it the preferred oblique method for large datasets where direct oblimin might be slower. In R, the psych package uses promax as one of its default oblique options, and many simulation studies rely on promax for that reason.
The difference between promax and varimax in factor analysis is straightforward once you understand the mechanism. Varimax stops at the orthogonal solution. Promax uses that same varimax solution as a starting point, then relaxes the orthogonality constraint to let factors correlate. If your factors are truly independent, promax and varimax will produce nearly identical results. If your factors share variance, promax will reveal correlations that varimax was forced to hide.
The kappa parameter controls how much promax sharpens the target matrix. Kappa equals two is gentle, kappa equals four is the standard default, and higher kappa values push the solution toward more extreme obliqueness. In nearly every applied setting, the default kappa of four produces a reasonable solution without further tuning.
Direct Oblimin vs Promax: Which to Choose
This is one of the most common questions on statistics forums, and the honest answer is that both methods usually produce similar solutions on real data. The choice rarely changes your substantive conclusions. That said, there are practical considerations.
Choose direct oblimin when you want fine-grained control over the degree of factor correlation through the delta parameter, or when you are following a methodology common in SPSS-based research where oblimin is the standard oblique option. Choose promax when you are working in R, dealing with large datasets where computational speed matters, or running simulation studies where promax is the conventional choice.
If you are uncertain, run both and compare. The factor correlation matrix and the high-loading pattern should tell a consistent story regardless of which oblique method you use. Large discrepancies between promax and oblimin results usually point to a deeper issue with the factor solution itself, such as an unstable factor structure or too few indicators per factor.
A general guideline from simulation research: when sample sizes are below 200 and factors have fewer than four indicators each, oblique methods can produce unstable solutions regardless of which one you pick. In those cases, the rotation choice is less important than addressing the sample size and indicator count problems first.
Varimax vs Oblique Rotation: Side-by-Side Comparison
The table below summarizes the key differences across the dimensions that matter most when you are deciding which rotation to use.
| Dimension | Varimax (Orthogonal) | Oblique (Promax, Oblimin) |
|---|---|---|
| Factor correlation allowed | No, forced to zero | Yes, determined by data |
| Angle between factor axes | Fixed at 90 degrees | Free to tilt |
| Output matrices | One rotated factor matrix | Pattern matrix plus structure matrix plus factor correlation matrix |
| Cross-loadings | May appear artificially when factors truly correlate | Usually cleaner because shared variance is handled by factor correlations |
| Effect on model fit | None, rotation never changes fit | None, rotation never changes fit |
| Effect on communalities | None, communalities are preserved | None, communalities are preserved |
| Effect on variance explained | None, total variance is unchanged | None, total variance is unchanged |
| Best for | Theoretically independent constructs, teaching, simple reporting | Realistic social and behavioral data where constructs overlap |
| Software default | Yes, in SPSS | No, must be selected manually |
| Interpretation difficulty | Low, single matrix to read | Moderate, requires understanding pattern versus structure matrix |
| Number of tuning parameters | None | Delta for oblimin, kappa for promax |
| Recommended threshold for switching | N/A | Factor correlations above 0.32 justify oblique |
Notice that model fit is identical for both. Rotation redistributes variance across factors but never changes the total variance explained, communalities, or how well the model reproduces the observed correlation matrix. Anyone who tells you their oblique solution “fit better” is conflating interpretability with fit.
Also notice that communalities and total variance explained are unchanged. This is worth emphasizing because forum posts frequently claim that oblique rotation “explains more variance.” It does not. The percentage of variance each factor accounts for will look different across rotation methods because variance is redistributed, but the total cumulative variance across all factors remains the same.
How to Choose Between Varimax and Oblique Rotation
Choosing a rotation method should be a deliberate decision, not a software default. The following five-step process walks you through the considerations that actually matter, drawing on the issues that come up repeatedly in statistics forums and consulting work.
Step 1: Ask Whether Your Constructs Could Theoretically Correlate
Start with theory, not data. Are your latent factors the kind of constructs that share variance in the real world? Anxiety and depression almost certainly overlap. Reaction time and political ideology probably do not. If your literature review suggests the constructs are related, plan for oblique rotation from the start. If they are conceptually independent, varimax is defensible.
This step matters more than any statistical test. Rotation is a modeling assumption about the structure of your constructs. Getting the assumption right based on theory is far more valuable than reverse-engineering a justification after the fact. Write down your theoretical expectation before you look at any output.
Step 2: Run the Analysis With Both Methods
There is no rule against trying both. Run varimax first since it is the simpler output. Then run an oblique rotation, either promax or direct oblimin, and examine the factor correlation matrix. If the factor correlations are below 0.30, the choice barely matters and varimax is fine. If correlations exceed 0.32 and especially above 0.50, oblique rotation is capturing real shared variance that varimax was masking.
Some methodologists recommend always starting with oblique rotation as your default and only switching to varimax if the factor correlations come back near zero. The logic is simple: oblique rotation tells you the truth about whether your factors correlate. If they do not, the oblique solution converges to the orthogonal one. If they do, you have the more honest solution already in hand.
Step 3: Compare Cross-Loadings
Look at the loading matrices from both solutions. Under varimax, do you see variables loading at 0.45 on one factor and 0.40 on another? Those cross-loadings may be artifacts of forced orthogonality. Switch to oblique and check whether the same variable now loads cleanly on one factor. Cleaner structures under oblique rotation are a strong signal that your factors genuinely correlate and varimax was distorting the picture.
Pay particular attention to items that you might otherwise drop. Many researchers delete “problem items” that show cross-loadings under varimax without realizing those cross-loadings are artifacts. Running oblique rotation first can save items that would have been unnecessarily discarded, preserving the content validity of your scale.
Step 4: Consider Your Audience and Reporting Context
Think about who will read your results. Academic reviewers in psychology and education expect oblique rotation because they know real constructs correlate. Applied audiences or clients unfamiliar with factor analysis may find a single varimax loading matrix easier to digest. If you choose oblique, be prepared to explain the pattern matrix, the structure matrix, and the factor correlation matrix in plain language.
For published research in social sciences, the convention has shifted firmly toward oblique rotation. Journals in psychology, education, and management increasingly expect authors to justify orthogonal rotation rather than oblique. If you are submitting to a peer-reviewed outlet, defaulting to oblique unless you have a strong theoretical reason otherwise will save you from reviewer pushback.
Step 5: Document Your Decision
Whatever you choose, state your reasoning in the methods section. “Varimax rotation was used because the constructs were hypothesized to be independent” is a complete justification. So is “Oblique rotation (direct oblimin, delta equals zero) was used because the theoretical constructs were expected to correlate.” Reviewers and future readers should never have to guess why you picked one over the other.
Good practice is to report the factor correlation matrix from the oblique solution even if you ultimately present the varimax results. This shows reviewers that you checked whether the orthogonality assumption was reasonable, and it gives them the information they need to evaluate your choice.
One warning that comes up constantly in forum discussions: do not default to varimax just because the output is simpler. The simplicity of varimax output is a presentation feature, not a statistical advantage. If your factors are correlated, the simpler-looking varimax matrix is actually misleading you about the structure of your data.
Pattern Matrix vs Structure Matrix Explained
This is the single biggest source of confusion when researchers switch from varimax to oblique rotation for the first time. Under varimax, you get one rotated factor matrix and you are done. Under oblique rotation, you get three things: a pattern matrix, a structure matrix, and a factor correlation matrix. Knowing which one to read is critical.
The pattern matrix contains the unique contribution of each variable to each factor, controlling for the other factors. Think of it as the regression coefficients if you predicted each variable from all the factors simultaneously. This is the matrix you use to decide which variables define which factors, and it is the one most researchers report in published papers.
The structure matrix contains the zero-order correlations between each variable and each factor, ignoring the other factors. Because correlated factors share variance, structure matrix loadings tend to be higher and more spread out than pattern matrix loadings. A variable might load at 0.50 on Factor 1 in the pattern matrix but 0.70 in the structure matrix because it picks up variance from a correlated factor.
The factor correlation matrix tells you how strongly the factors themselves relate. This is the oblique advantage in action. A correlation of 0.55 between two factors means they share about 30 percent of their variance, which is meaningful information that varimax cannot provide.
Which matrix do you report? The general consensus in the methodology literature is to interpret and report the pattern matrix as your primary loading table, while also reporting the factor correlation matrix so readers can see the relationships between factors. The structure matrix is useful for understanding why certain cross-loadings appear, but it is rarely the focus of interpretation.
One common pitfall: reading the structure matrix by mistake and concluding that your solution has terrible cross-loadings. The structure matrix will almost always show more cross-loadings than the pattern matrix because it includes shared variance from correlated factors. If you are using oblique rotation, make sure you are looking at the pattern matrix when you decide which variables load on which factors.
Another pitfall: reporting only the structure matrix in a published paper. Because structure loadings are inflated by factor correlations, they can make a weak factor solution look stronger than it really is. Reviewers who are methodologically literate will catch this. Always report the pattern matrix as your primary results table.
If you want a deeper understanding of the math: the structure matrix equals the pattern matrix multiplied by the factor correlation matrix. In notation, S equals P times Phi, where S is the structure matrix, P is the pattern matrix, and Phi is the factor correlation matrix. This relationship is why structure loadings are always at least as large as pattern loadings in absolute value when factors are positively correlated.
Common Pitfalls and Mistakes to Avoid
After working with researchers across multiple fields, I have compiled the most common mistakes related to rotation choice. Avoiding these will save you time and prevent embarrassing reviewer comments.
First, do not assume the SPSS default is correct for your data. Varimax is the default for historical reasons, not because it is statistically superior. Always question whether the orthogonal assumption matches your theoretical understanding of the constructs.
Second, do not conflate interpretability with model fit. Rotation never changes how well your model reproduces the data. A cleaner-looking loading matrix is easier to interpret, not a better fit. Report the appropriate fit indices from the extraction step, not the rotation step.
Third, do not delete items based solely on cross-loadings under varimax before checking oblique rotation. Many “problem items” turn out to load cleanly once the orthogonality constraint is relaxed. Deleting items unnecessarily damages the content validity of your scale.
Fourth, do not interpret the structure matrix as your primary loading table. The pattern matrix is what you use to assign variables to factors. The structure matrix contains useful diagnostic information but should not drive your factor interpretation.
Fifth, do not run oblique rotation and then ignore the factor correlation matrix. Those correlations are the entire reason you chose oblique rotation in the first place. Report them, interpret them, and connect them back to your theoretical framework.
Sixth, do not switch rotation methods mid-analysis without re-examining your entire solution. If you change from varimax to oblique after deleting items, the item deletions you made under varimax may no longer be necessary. Re-run the full analysis from the beginning with the new rotation method.
Reporting Rotation Results in Academic Papers
How you report your rotation choice matters for transparency and reproducibility. A strong methods section specifies the extraction method, the rotation method, any tuning parameters, and the rationale for the choice.
For varimax, a complete description might read: “Factors were extracted using principal axis factoring and rotated using varimax (orthogonal) rotation. An orthogonal solution was deemed appropriate because the theoretical constructs were hypothesized to be independent.” This tells the reader everything they need to evaluate your choice.
For oblique rotation, a complete description might read: “Factors were extracted using maximum likelihood estimation and rotated using direct oblimin rotation (delta equals zero). Oblique rotation was selected because the latent constructs were theoretically expected to share variance.” Include the factor correlation matrix in your results table or appendix.
Always report the rotated loading matrix, the communalities, the variance explained by each factor after rotation, and (for oblique solutions) the factor correlation matrix. Loading tables should indicate which loadings were used to define each factor, typically by bolding values above your threshold (commonly 0.32 or 0.40).
Frequently Asked Questions
Is varimax oblique rotation?
No. Varimax is an orthogonal rotation method that keeps factor axes at a fixed 90-degree angle, which forces the extracted factors to be uncorrelated. Oblique rotation methods such as promax and direct oblimin are the ones that allow factors to correlate. A rotation is either orthogonal or oblique, never both.
What is the difference between varimax and oblimin rotation?
Varimax is an orthogonal rotation that keeps factors uncorrelated by holding the axes at 90 degrees. Direct oblimin is an oblique rotation that lets the axes tilt so factors can correlate. Varimax produces a single loading matrix, while oblimin produces a pattern matrix, a structure matrix, and a factor correlation matrix. When factors are truly independent the two methods give similar results; when factors share variance, oblimin usually gives cleaner loadings.
When should I use oblique rotation instead of varimax?
Use oblique rotation when your theoretical constructs are likely to share variance, which is common in psychology, education, and social science research. A practical rule is to run both methods and check the factor correlation matrix from the oblique solution. If correlations exceed 0.32, oblique rotation is capturing real shared variance and is the better choice.
What is the difference between promax and varimax in factor analysis?
Varimax stops at an orthogonal solution where factors are forced to be uncorrelated. Promax starts from a varimax solution, then relaxes the orthogonality constraint to let factors correlate. If your factors are genuinely independent, promax and varimax produce nearly identical results. If your factors share variance, promax reveals correlations that varimax was forced to hide.
Does rotation change the model fit or variance explained?
No. Rotation redistributes variance across factors for easier interpretation but never changes the total variance explained, the communalities, or how well the model reproduces the observed correlation matrix. Varimax and oblique rotation produce identical model fit. What differs is interpretability and whether factors are allowed to correlate.
What is the difference between a pattern matrix and a structure matrix?
The pattern matrix shows the unique contribution of each variable to each factor after controlling for the other factors. The structure matrix shows the total correlation between each variable and each factor, including variance shared through correlated factors. Researchers interpret and report the pattern matrix as the primary loading table, while the structure matrix is used diagnostically.
Should I use direct oblimin or promax for oblique rotation?
Both methods usually produce similar results on real data. Choose direct oblimin for fine-grained control through the delta parameter or when working in SPSS. Choose promax for computational speed on large datasets or when working in R with the psych package. Run both if you are uncertain and compare the factor correlation matrices.
Conclusion
The difference between varimax and oblique rotation comes down to a single assumption about whether your latent factors are allowed to correlate. Varimax enforces independence by keeping the axes at 90 degrees, which produces clean, simple output but can create artificial cross-loadings when constructs genuinely overlap. Oblique methods like promax and direct oblimin let the data reveal the true factor correlations, producing a pattern matrix, a structure matrix, and a factor correlation matrix that give you a more honest picture of how your constructs relate.
If you take away one principle, let it be this: never accept the varimax default without first asking whether your factors should plausibly be independent. Run both methods, compare the factor correlations, and choose the rotation that matches the structure of your data. Your future self, your reviewers, and anyone trying to replicate your factor solution will thank you for the deliberate choice.