
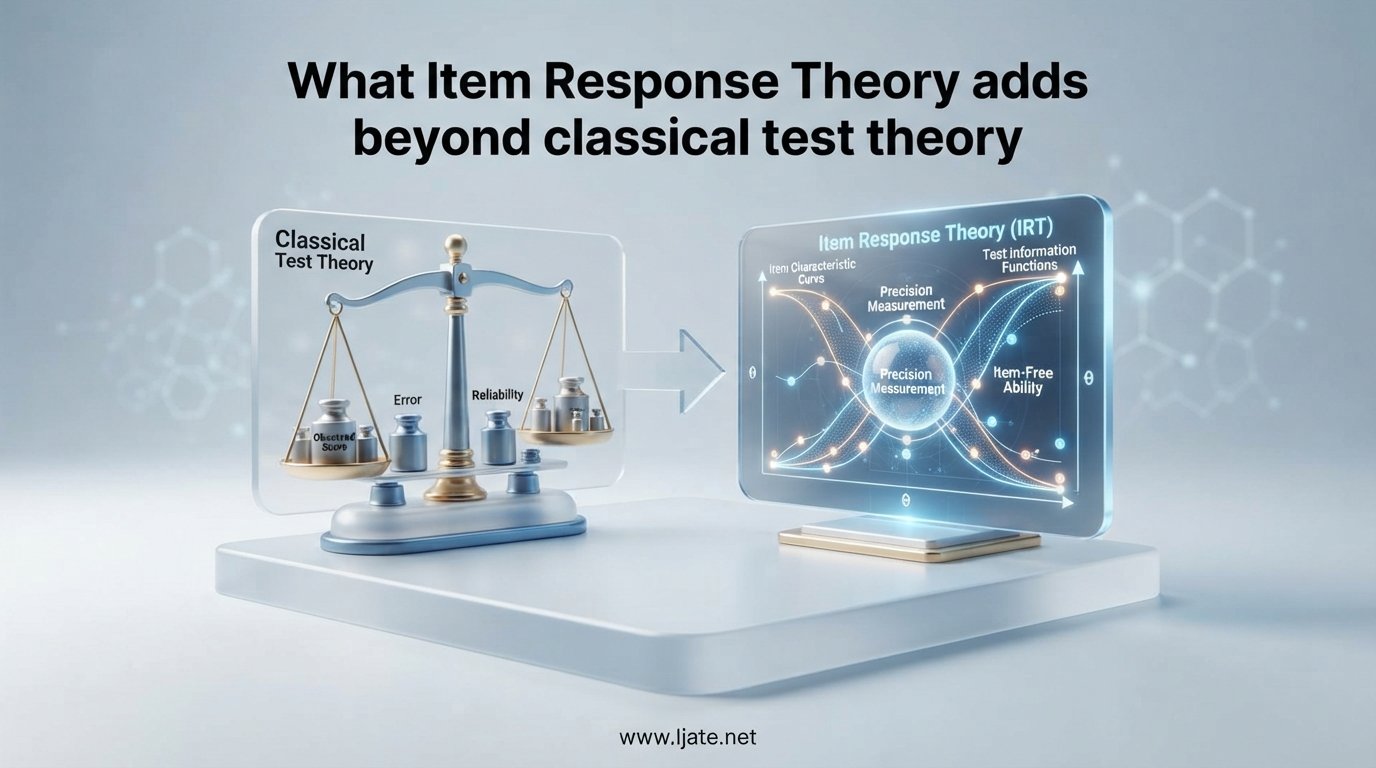
If you have ever developed a test, a questionnaire, or any measurement instrument, you have probably faced the same question that psychometricians have debated for decades: should you stick with Classical Test Theory (CTT) or move to Item Response Theory (IRT)?
Both frameworks exist to help us understand whether our items measure what they claim to measure and whether our scores are reliable. But they approach that goal from fundamentally different angles, and the gap between what each one can tell you is wider than most people realize.
Here is the short answer: Item Response Theory adds five things beyond classical test theory — (1) item and person parameter invariance, (2) conditional measurement precision that varies by ability level, (3) the mathematical foundation for computerized adaptive testing, (4) item banking with freely exchangeable items across test forms, and (5) sophisticated test equating and linking across different administrations. CTT can approximate some of these benefits in limited ways, but only IRT provides them as built-in properties of the model itself.
That distinction matters whether you are building a certification exam taken by hundreds of thousands of candidates, developing a patient-reported outcome measure for a clinical trial, or simply trying to improve the quality of a classroom assessment. The choice between CTT and IRT shapes what questions you can answer about your data, how precise your conclusions can be, and how flexibly you can deploy your items in the future.
In this guide, our team breaks down what each framework actually does, where they overlap, and exactly what IRT adds beyond what CTT can offer. We draw on published research, including a published study applying both CTT and IRT methods, as well as practitioner experiences from the psychometrics community. Whether you are a researcher, educator, or test developer, by the end of this article you will have a clear, practical understanding of when IRT is worth the investment and when CTT is perfectly adequate.
Table of Contents
What Is Classical Test Theory (CTT)?
Classical Test Theory is the older of the two frameworks, and it remains the most widely used approach to test analysis in education, psychology, and survey research. At its core, CTT is built on a simple but powerful idea: every observed score is a combination of a true score and a random measurement error.
The foundational equation is straightforward. A person’s observed score (X) equals their true score (T) plus an error term (E): X = T + E. That error is assumed to be random, uncorrelated with the true score, and normally distributed. Everything in CTT flows from that decomposition.
Several key concepts emerge from this model. The true score represents the score a person would get on an infinitely long test with no random error. The observed score is what you actually measure. The gap between them is the error of measurement, and the theory focuses heavily on quantifying how large that gap tends to be.
Reliability in CTT is defined as the ratio of true score variance to observed score variance. If most of the variation in observed scores reflects true differences between people rather than error, your test is reliable. The most common statistic for estimating reliability is Cronbach’s alpha, which gives you a single number summarizing the internal consistency of your items.
Item analysis in CTT relies on two main statistics. The p-value (proportion correct) serves as the item difficulty index — a high p-value means an easy item, and a low p-value means a hard one. The point-biserial correlation measures how well each item discriminates between high and low scorers on the overall test.
For a deeper look at how difficulty estimates work in practice, you can explore research on difficulty estimation methods published in the Ijate journal.
CTT has genuine strengths that explain its lasting popularity. It is easy to understand — most researchers can grasp the core concepts in a single workshop. It works well with small sample sizes, sometimes as few as 50 to 100 examinees. The statistics are simple to compute in any statistical software, and the results are easy to communicate to non-specialists.
But CTT has a set of structural limitations that become increasingly problematic as your measurement goals grow more ambitious. These limitations are precisely what motivated the development of IRT, so understanding them is essential for appreciating what IRT adds.
The biggest issue is sample dependence. Every statistic in CTT — item difficulty, item discrimination, reliability — is defined relative to the specific sample of people who took the test and the specific set of items they answered. Change the sample, and the item statistics change. Change the test form, and the person scores change. There is no way around this within the CTT framework itself.
A second limitation is that CTT provides a single reliability estimate for the entire test. That single Cronbach’s alpha value tells you the average precision across all ability levels, but it cannot tell you whether your test measures equally well for high performers, low performers, and those in the middle. In reality, most tests are most precise in the middle of the ability range and less precise at the extremes, but CTT has no mechanism to show you that pattern.
A third limitation is that CTT scores are test-dependent. If a person takes a short form of a test and scores 15 out of 20, that score is not directly comparable to a score of 30 out of 40 on a longer form. The two forms may have different items with different difficulty levels, and CTT provides no principled way to put those scores on the same scale.
These limitations — sample dependence, a single precision estimate, and test-dependent scores — are not minor annoyances. They are the reason that large-scale testing programs, certification bodies, and health outcomes researchers turned to IRT for solutions that CTT fundamentally cannot provide.
What Is Item Response Theory (IRT)?
Item Response Theory is a family of mathematical models that describe the relationship between a person’s underlying ability (called a latent trait, represented by the Greek letter theta) and the probability that they will respond correctly to a specific item.
Unlike CTT, which works at the level of total test scores, IRT works at the level of individual items and individual people simultaneously. The model links each person’s latent ability to each item’s characteristics through a mathematical function, typically a logistic curve.
Two core assumptions underpin most IRT models. The first is unidimensionality — the assumption that a single latent trait accounts for the performance on all items in the test. The second is local independence — the assumption that once you account for a person’s ability level, responses to different items are statistically independent of each other. No item gives you information about another item beyond what the latent trait already tells you.
The visual centerpiece of IRT is the item characteristic curve (ICC). This S-shaped logistic curve plots the probability of a correct response across the entire range of ability (theta). At the left side of the curve, low-ability individuals have a low probability of answering correctly. At the right side, high-ability individuals have a high probability. The steepness and position of the curve tell you exactly how the item behaves at every ability level.
IRT models items using up to three parameters. The difficulty parameter (b) indicates the ability level at which a person has a 50% chance of answering correctly. The discrimination parameter (a) measures how well the item differentiates between people above and below that difficulty point — the steepness of the curve. The guessing parameter (c), used only in some models, accounts for the probability that a low-ability person might guess correctly.
For tests with polytomous items — those with multiple ordered response categories like Likert scales — IRT extends to models such as the partial credit model and the graded response model. These models produce category response curves that show the probability of selecting each response option across the ability continuum. For more on this topic, you can read about explanatory IRT models for polytomous items.
Two derived functions make IRT especially powerful for measurement design. The item information function tells you how much measurement precision each item contributes at each ability level. The test information function sums these across all items and shows you the precision profile of your entire test. This is where IRT’s ability to tell you about conditional precision comes from.
The standard error of measurement in IRT is not a single number. It varies across ability levels, inversely related to the square root of the test information at each point. Where your test provides a lot of information, scores are precise. Where information is low, scores are imprecise. IRT shows you exactly where your measurement is strong and where it is weak.
The Three Core IRT Models: 1PL, 2PL, and 3PL
IRT is not a single model but a family, and the three most commonly used models for dichotomous (correct/incorrect) items differ in how many parameters they estimate for each item.
The 1PL Model (Rasch Model)
The one-parameter logistic model, also called the Rasch model, estimates only the difficulty parameter for each item. All items are assumed to have the same discrimination power. This constraint is not merely a simplification — it is a deliberate design choice. The Rasch model produces interval-level measurement on a logit scale, which has specific mathematical properties that some measurement theorists consider essential for genuine measurement.
The Rasch model is favored in developmental and exploratory research because it works with smaller sample sizes (often 100 to 200 respondents) and because its strict assumptions provide a clear diagnostic framework. When items do not fit the Rasch model, you know immediately which items violate the equal-discrimination assumption and can investigate why.
The 2PL Model
The two-parameter logistic model estimates both difficulty and discrimination for each item. This means some items can be better at differentiating between ability levels than others. Items with high discrimination are steep — they provide a lot of information in a narrow ability range. Items with low discrimination are flatter and provide information across a broader range but with less precision at any single point.
The 2PL model requires larger sample sizes than the Rasch model, typically 500 or more respondents for stable parameter estimation. It is widely used in educational testing where different items genuinely have different discrimination levels and forcing them to be equal would distort the model.
The 3PL Model
The three-parameter logistic model adds a guessing parameter. This is the probability that a very low-ability person will answer correctly by chance. The 3PL model is most commonly used in multiple-choice testing where guessing is a realistic concern, such as certification examinations and admissions tests.
The guessing parameter makes the lower asymptote of the item characteristic curve float above zero rather than approaching zero. This prevents the model from attributing correct answers by low-ability examinees to actual ability. The trade-off is that 3PL models require the largest sample sizes — often 1,000 or more respondents — because three parameters per item is a heavy estimation burden.
Polytomous IRT Models
Many real-world instruments use items with more than two response categories. Survey items rated on Likert scales, partial-credit exam questions, and rating scales all require polytomous IRT models. The partial credit model (PCM) and the rating scale model are extensions of the Rasch approach, while the graded response model (GRM) and generalized partial credit model extend the 2PL framework. Each produces category response curves that show the probability of selecting each option at every ability level.
Rasch vs General IRT: What Is the Difference?
This is a common source of confusion. The Rasch model is technically a specific instance of IRT — it is the 1PL model. However, the Rasch measurement tradition differs philosophically from general IRT. Rasch practitioners treat the model as a criterion that the data must fit, rather than a tool that adapts to the data. In the general IRT tradition (2PL, 3PL), the model is selected to best represent the data you have. Both approaches are legitimate, and the choice often comes down to your measurement philosophy and practical constraints.
What Item Response Theory Adds Beyond Classical Test Theory: Direct Comparison
Now we get to the heart of the matter. When someone asks what IRT adds beyond CTT, they are really asking about the practical, measurable differences that emerge when you use IRT instead of (or alongside) CTT. Let us walk through each dimension where the two frameworks diverge.
1. Unit of Analysis: Test-Level vs Item-and-Person Level
CTT operates primarily at the test level. Its core statistics — reliability, standard error of measurement, total scores — describe the test as a whole. Item statistics (p-value, point-biserial) exist but are derived from and dependent on the total test score.
IRT operates simultaneously at the item level and the person level. Each item has its own model-based parameters that are estimated independently of total scores. Each person has a theta estimate that is independent of which specific items they answered. This dual-level modeling is what makes most of IRT’s advantages possible.
2. Item Statistics: Sample-Dependent vs Invariant
In CTT, the p-value of an item depends entirely on who took the test. An item that has a p-value of 0.60 in a general population sample might have a p-value of 0.90 if administered to a high-performing group. The difficulty ranking of items can even flip between samples. This makes it impossible to compare item statistics across different administrations or populations without statistical adjustments.
In IRT, item parameters are designed to be invariant across samples (within a linear transformation). The difficulty parameter of an item is estimated on the theta scale, which is a property of the item itself, not of the sample. Whether you administer the item to easy or hard populations, the parameter estimates should converge on the same value after appropriate scale alignment. This is one of the most consequential properties of IRT and is what enables item banking.
3. Person Scores: Test-Dependent vs Invariant
In CTT, a person’s score depends on which items they answered. A person who answers 18 out of 20 easy items correctly gets the same raw score (18/20) as someone who answers 18 out of 20 hard items correctly, even though their underlying abilities are very different. The raw score does not carry information about item difficulty.
In IRT, a person’s theta estimate is independent of the specific items they answered, provided the items measure the same latent trait. Two people with the same theta will get the same score on the ability scale regardless of which items they took. This person parameter invariance is what makes it possible to compare scores across different test forms, different test lengths, and even different testing occasions.
4. Measurement Precision: Single Value vs Conditional Curve
CTT gives you one reliability coefficient (typically Cronbach’s alpha) and one standard error of measurement for the entire test. That single SEM applies to every score at every ability level, even though we know that most tests measure differently at different points on the ability scale.
IRT gives you a conditional standard error of measurement that changes across the ability continuum. The test information function shows you exactly where your test is most and least precise. You can see whether your test is good at distinguishing among average performers but poor at the extremes, and you can do something about it by adding items that provide information where you need it.
This is not a minor improvement. For high-stakes decisions near a cut score, knowing the precision at that specific ability level is critical. A test with an overall reliability of 0.90 might have much lower precision near a specific passing score, and only IRT can reveal that.
5. Adaptive Testing: Impossible vs Built-In
Computerized adaptive testing (CAT) is nearly impossible to implement with CTT. Because CTT scores are item-dependent, you cannot meaningfully compare scores from different sets of items administered to different people. If Person A gets 10 easy items and Person B gets 10 hard items, their raw scores are on different scales.
IRT was designed for adaptive testing. Because person scores are item-independent, the computer can select items matched to each person’s current ability estimate, update the estimate after each response, and continue until a desired precision level is reached. This is how the GRE, GMAT, and many certification exams work today. IRT makes it mathematically possible.
6. Test Equating: Approximate vs Model-Based
Test equating — putting scores from different test forms on the same scale — is a fundamental need for any testing program that uses multiple forms. CTT requires elaborate equating designs with common-person or common-item linking, and the results are only as good as the linking design allows.
IRT makes equating a natural consequence of the model. Because item parameters are invariant (within a transformation), you can calibrate items from different forms on the same theta scale simply by including a set of linking items. The math handles the scale alignment automatically through transformations like the Stocking-Lord method. This is why virtually all major testing programs use IRT for equating.
7. Item Banking: Limited vs Powerful
An item bank is a large pool of calibrated items from which you can assemble test forms on demand. With CTT, building an item bank is problematic because item statistics change across samples. You cannot simply pull items from a bank and expect their CTT statistics to generalize to a new population.
With IRT, item banking works naturally. Each item has invariant parameters on the theta scale. You can store thousands of items in a bank, assemble any subset into a test form, and know exactly what the precision profile of that form will be before anyone takes it. You can target specific ability ranges, balance content, and even generate multiple parallel forms with equivalent measurement properties.
8. Vertical Scaling: Awkward vs Straightforward
Vertical scaling — putting scores from tests of different difficulty levels on a single developmental scale — is important for measuring growth across grade levels or ability ranges. CTT can approximate vertical scaling through complex equating chains, but the process is cumbersome and depends on strong assumptions.
IRT handles vertical scaling through the same calibration and linking procedures used for horizontal equating. Because theta is defined independently of item difficulty, you can calibrate items from a grade-3 test and a grade-5 test on the same scale, producing a vertical scale that shows growth over time. This is widely used in large-scale educational assessment programs.
9. Differential Item Functioning: Limited vs Model-Based
Differential item functioning (DIF) occurs when an item performs differently for different groups (such as males and females) after controlling for overall ability. CTT can detect DIF through methods like the Mantel-Haenszel procedure, but these methods are somewhat blunt instruments.
IRT provides a natural framework for DIF analysis because item parameters can be estimated and compared across groups directly. If the difficulty or discrimination parameter of an item differs significantly between groups, you have evidence of DIF. This model-based approach is more sensitive and more informative than CTT-based methods. For a deeper dive, see studies investigating differential item functioning in the Ijate journal.
10. Guessing: Ignored vs Modeled
CTT has no mechanism for accounting for guessing on multiple-choice items. If a low-ability student guesses correctly, CTT treats that correct answer the same as a correct answer from a high-ability student. This inflates the scores of low-ability test takers and distorts item statistics.
The 3PL IRT model explicitly estimates a guessing parameter for each item. This allows the model to account for the fact that some items are more guessable than others and to adjust ability estimates accordingly. For high-stakes multiple-choice tests, this correction can make a meaningful difference in score accuracy.
11. Distractor Analysis: CTT Advantage vs IRT Limitation
It is worth noting one area where CTT has an edge. CTT provides straightforward distractor analysis — you can examine the proportion of people choosing each incorrect option and correlate that with total score. This is useful for identifying poorly functioning distractors.
IRT, in its standard dichotomous form, does not analyze distractors directly because it only models correct versus incorrect. (There are nominal response models in IRT that do analyze distractors, but they are less commonly used.) Many testing programs use CTT distractor analysis alongside IRT calibration for this reason.
12. Interpretability: Simple vs Complex
CTT results are easy to explain. Most stakeholders understand percentages and correlations. IRT results — logit scales, item information functions, theta estimates — require more statistical knowledge to interpret correctly. This is a real practical consideration, especially when communicating results to non-technical audiences.
The trade-off is that IRT results, while harder to explain, are more accurate and more actionable. The question is whether the added precision is worth the added complexity for your specific application.
The 5 Key Advantages IRT Adds Beyond CTT
Now let us consolidate the comparison into the five most important things IRT adds — the advantages that make it worth the additional complexity for many testing programs.
Advantage 1: Item and Person Parameter Invariance
Parameter invariance is the single most important property IRT adds beyond CTT. Item parameters do not depend on the sample of examinees, and person parameters do not depend on the specific items administered. This is what enables everything else on this list — item banking, adaptive testing, test equating, and vertical scaling all depend on invariance.
In practice, invariance means you can calibrate items once, store them in a bank, and reuse them confidently across different populations and test forms. You can compare scores from different forms directly. You can administer different item subsets to different people and still place them on the same ability scale. None of this is possible with CTT.
Invariance is not perfect in real data — it holds approximately, not exactly, and requires that the model fits the data adequately. But even approximate invariance is far more useful than the complete sample dependence of CTT statistics.
Advantage 2: Conditional Measurement Precision
IRT tells you exactly how precisely your test measures at every point on the ability scale. The test information function is a curve, not a number, and it reveals where your measurement is strong and where it is weak. If you need to make a high-stakes decision at a specific cut score, you can design your test to maximize information at that point.
CTT’s single reliability coefficient cannot do this. A test with an alpha of 0.90 might be excellent at distinguishing average performers but terrible at the extremes. With CTT, you would never know. With IRT, you see it immediately in the test information curve.
This capability is especially important for certification and licensure testing, where the pass/fail decision is made at a specific score. Being able to show that your test is highly precise at the cut score is a significant advantage for defensibility.
Advantage 3: Computerized Adaptive Testing
Adaptive testing tailors the difficulty of items to each test taker in real time. High-ability examinees get harder items; low-ability examinees get easier items. The result is that every person gets a test targeted at their ability level, which means you need fewer items to achieve the same measurement precision.
This is only possible because IRT produces item-independent person scores. After each response, the computer updates the ability estimate and selects the next item from the bank that will provide the most information at that level. The test stops when a predefined precision threshold is reached.
The practical benefits are enormous. Adaptive tests can be 50% shorter than fixed-form tests with equivalent or better precision. Test takers spend less time and experience less frustration because they are not answering items that are far too easy or far too hard for them. Security is improved because everyone gets a different test.
As practitioners in the testing community frequently note, adaptive testing is nearly impossible without IRT but works smoothly once you have a well-calibrated item bank.
Advantage 4: Item Banking and Flexible Test Assembly
Once your items are calibrated using IRT, you have an item bank — a pool of items with known, invariant measurement properties. From this bank, you can assemble test forms to specification. You can target specific ability ranges, ensure content coverage, create parallel forms with equivalent precision, and produce new forms on demand.
This transforms test development from a one-off exercise into an ongoing, flexible process. Instead of building a new test from scratch for each administration, you draw from the bank and let the IRT parameters tell you what the precision profile of the assembled form will be — before anyone takes it.
CTT cannot support this workflow because item statistics change across samples. A CTT item bank would require recalculating all statistics for every new population, which defeats the purpose.
Advantage 5: Sophisticated Test Equating and Linking
Any testing program that uses multiple forms needs equating — the statistical process of adjusting for differences in form difficulty so that scores are comparable across forms. IRT makes equating a natural part of the calibration process. By including linking items in different forms, you can place all item parameters on the same theta scale and produce equated scores directly.
IRT-based equating is more flexible, more accurate, and more defensible than the CTT alternatives. It supports horizontal equating (between forms of similar difficulty), vertical scaling (between forms of different difficulty levels), and linking across different testing programs or instruments that measure the same construct.
For large-scale testing programs, this is often the decisive advantage. The ability to maintain score comparability across dozens of forms, hundreds of administrations, and years of operation is something that only IRT can provide at scale.
Sample Size Requirements: CTT vs IRT
One of the most common questions in the psychometrics community is: what sample size do I actually need for IRT? The answer depends on the model and your goals, but the general guidance is well-established.
CTT can work with very small samples. Item analysis statistics like p-values and point-biserial correlations can be meaningfully computed with as few as 50 respondents, though 100 to 200 is preferable for stable estimates. Reliability analysis (Cronbach’s alpha) can be reported with samples of 30 or more. This makes CTT accessible for small studies, pilot work, and classroom-level research.
For IRT, sample size requirements scale with model complexity. The Rasch model (1PL) can produce stable parameter estimates with 100 to 200 respondents, especially for short instruments. This is because the Rasch model estimates only one parameter per item, which keeps the estimation burden manageable. Forum practitioners report that the Rasch model is the most practical IRT approach for moderate-sample research.
The 2PL model typically requires 500 or more respondents for stable estimation. The discrimination parameter adds an additional estimate per item, and the increased complexity demands more data to achieve convergence and stable standard errors.
The 3PL model generally needs 1,000 or more respondents. The guessing parameter is notoriously difficult to estimate and requires large samples, especially if the guessing rate is low. For this reason, many practitioners default to the 2PL model unless there is a compelling reason to model guessing.
Recent advances in Bayesian IRT estimation, including Markov Chain Monte Carlo (MCMC) methods and informative prior distributions, have made it possible to fit IRT models with smaller samples than traditional maximum likelihood approaches require. These methods are particularly promising for small-sample research where classical IRT estimation would be unstable or fail to converge.
The practical takeaway: if you have fewer than 200 respondents, CTT and the Rasch model are your best options. With 200 to 500, the Rasch model is solid and 2PL becomes possible. With 500 to 1,000, 2PL works well. With 1,000 or more, you can confidently use any IRT model including 3PL.
When to Use CTT vs IRT: Practical Guidance
Despite everything we have covered, IRT is not always the right choice. CTT remains a perfectly good framework for many applications, and forcing IRT into situations where CTT would suffice wastes time and resources. Here is our practical guidance for choosing between them.
When CTT Is Sufficient
Use CTT when you have a small sample (under 200 respondents) and IRT models would be unstable. Use it for one-time assessments where you will never need to equate forms or build an item bank. Use it for classroom tests, internal program evaluations, and exploratory pilot work where the goal is to get a quick read on item quality and test reliability.
CTT is also appropriate when your audience needs simple, intuitive results. If you are reporting to stakeholders who have no statistical background and need to understand the results quickly, CTT statistics are far easier to explain than IRT parameters.
Finally, use CTT when you need distractor analysis. CTT provides straightforward tools for examining how each distractor functions, which is valuable for improving multiple-choice items. Some IRT nominal response models can do this too, but they are less accessible.
When IRT Is Necessary
Use IRT when you are building or maintaining a large-scale testing program with multiple test forms. Use it when you need adaptive testing. Use it when you need to equate scores across different forms, different administrations, or different time points. Use it when you need to know the precision of your test at specific ability levels, especially near cut scores.
Use IRT when you are developing an item bank that will be reused over time. Use it when you are developing patient-reported outcome measures for clinical research, where measurement precision and invariance across populations are essential. Use it when you are conducting DIF analysis and need the sensitivity of model-based approaches.
Use IRT when you need vertical scaling to measure growth across ability levels or grade levels. And use it when you need to demonstrate the psychometric quality of your instrument to regulatory bodies, accreditation agencies, or peer reviewers who expect modern measurement standards.
Using Both Frameworks Together
The most widely endorsed approach in the psychometrics community is to use both CTT and IRT together. CTT provides quick, intuitive item analysis that is useful for screening items during development. IRT provides the model-based analysis needed for calibration, equating, and adaptive testing. Many testing programs use CTT for initial item screening and IRT for formal calibration.
This combined approach gives you the best of both worlds. You get the accessibility and speed of CTT for routine analysis and the power and precision of IRT for high-stakes measurement decisions. It also means that your team does not need to be IRT experts to conduct routine item analysis — they can use CTT tools and escalate to IRT when needed.
Software Tools for CTT and IRT
Accessibility of software is a real factor in the CTT vs IRT decision. CTT analysis can be done in virtually any statistical software — SPSS, R, SAS, Stata, even Excel with the right formulas. Cronbach’s alpha, p-values, and point-biserial correlations are standard procedures available everywhere.
IRT software is more specialized but has become increasingly accessible. R packages like mirt, ltm, and eRm provide powerful IRT estimation at no cost. Commercial software like IRTPRO, flexMIRT, and Winsteps are widely used in professional testing. JASP and other user-friendly platforms have added IRT capabilities that lower the barrier to entry. The learning curve is real, but the tools are available.
Common Misconceptions About IRT
Before we wrap up, let us address a few misconceptions that frequently appear in forum discussions and practitioner conversations.
Misconception: IRT always requires huge samples. While the 3PL model does need large samples, the Rasch model works well with 100 to 200 respondents. Recent Bayesian methods have pushed IRT into even smaller sample territory. The blanket statement that IRT requires 1,000+ respondents is outdated.
Misconception: IRT replaces CTT. The two frameworks answer different questions. CTT provides intuitive item analysis and reliability information. IRT provides model-based calibration and precision analysis. Most professional testing programs use both.
Misconception: IRT is only for large-scale testing. IRT is valuable for any measurement application where precision, invariance, or form comparability matters — including small-scale instrument development and validation. The Rasch model, in particular, is well-suited to small-scale research.
Misconception: IRT is too complex to explain to stakeholders. While IRT parameters are less intuitive than CTT statistics, you can present IRT results in accessible ways. Item characteristic curves, test information curves, and Wright maps (person-item maps) are visual tools that communicate IRT concepts effectively to non-technical audiences.
Misconception: Rasch is not really IRT. The Rasch model is the 1PL model and is mathematically a special case of IRT. The Rasch measurement tradition has a distinct philosophy, but the model itself is part of the IRT family. The distinction is philosophical, not mathematical.
IRT in Health Outcomes and Patient-Reported Measures
One area where IRT has added substantial value beyond CTT is in health outcomes measurement. Patient-reported outcome (PRO) measures — instruments that capture patients’ own reports of their symptoms, functioning, and quality of life — have increasingly adopted IRT-based approaches.
The PROMIS (Patient-Reported Outcomes Measurement Information System) initiative, funded by the National Institutes of Health, used IRT to develop a comprehensive system of PRO measures across multiple health domains. IRT enabled the PROMIS team to build item banks, implement computerized adaptive testing, and produce scores that are comparable across different instruments and populations.
None of this would have been possible with CTT. The ability to calibrate items on a common theta scale, select items adaptively, and produce precise scores at every level of the health construct being measured required the model-based framework of IRT. This real-world application demonstrates exactly what IRT adds: measurement that is more precise, more flexible, and more comparable than what CTT can deliver.
FAQs
Why is item response theory better than classical test theory?
IRT is better than CTT for large-scale and high-stakes measurement because it provides five things CTT cannot: item and person parameter invariance across samples and forms, conditional measurement precision that varies by ability level, support for computerized adaptive testing, item banking with freely exchangeable items, and model-based test equating. CTT is simpler and works with smaller samples, but IRT is essential when you need comparable scores across forms, adaptive delivery, or precision information at specific ability levels.
What makes item response theory different from classical theory?
The key difference is that CTT works at the test-score level with sample-dependent statistics, while IRT models the probability of each item response as a function of a person’s latent ability (theta). This means IRT item parameters are designed to be invariant across samples, person scores are independent of which items they took, and measurement precision is reported as a conditional curve rather than a single reliability number. IRT also models item difficulty, discrimination, and guessing as separate parameters rather than collapsing them into p-values and correlations.
What is the item response theory for tests?
Item Response Theory (IRT) is a family of psychometric models that describes the relationship between a person’s latent ability and the probability of responding correctly to each test item. It uses logistic functions (item characteristic curves) parameterized by item difficulty, discrimination, and sometimes guessing to model response patterns. IRT produces ability estimates (theta) that are independent of the specific items administered, enabling adaptive testing, item banking, test equating, and conditional precision analysis.
What is the difference between Rasch and IRT?
The Rasch model is technically a specific case of IRT u002du002d it is the one-parameter logistic (1PL) model that estimates only item difficulty and assumes equal discrimination across all items. The philosophical difference is that the Rasch tradition treats the model as a standard the data must fit, while general IRT (2PL, 3PL) selects models to best represent the data. Practically, the Rasch model works with smaller samples (100-200), produces interval-level measurement, and is favored in developmental research, while 2PL and 3PL models are used when items genuinely differ in discrimination or when guessing must be modeled.
Conclusion: What IRT Truly Adds Beyond CTT
When we set out to answer what Item Response Theory adds beyond classical test theory, the answer comes down to five core additions: parameter invariance (items and people), conditional measurement precision, adaptive testing capability, item banking with flexible test assembly, and model-based test equating. These are not marginal improvements — they transform what is possible in measurement design.
CTT remains a valuable and accessible framework, especially for small-sample research, routine item analysis, and situations where simplicity matters. But for any testing program that needs comparable scores across forms, adaptive delivery, precise measurement at specific ability levels, or a reusable item bank, IRT provides capabilities that CTT simply cannot match.
The practical recommendation endorsed by the psychometrics community is to use both frameworks together. Start with CTT for quick screening and intuitive analysis, then apply IRT for formal calibration, equating, and high-stakes measurement decisions. If you are working with smaller samples, the Rasch model gives you many of IRT’s advantages without the heavy data requirements.
Ultimately, the question of what Item Response Theory adds beyond classical test theory is not about which framework is universally better. It is about which capabilities you need for your specific measurement goals. If those goals include any of the five additions we have described, IRT is the right tool for the job.