
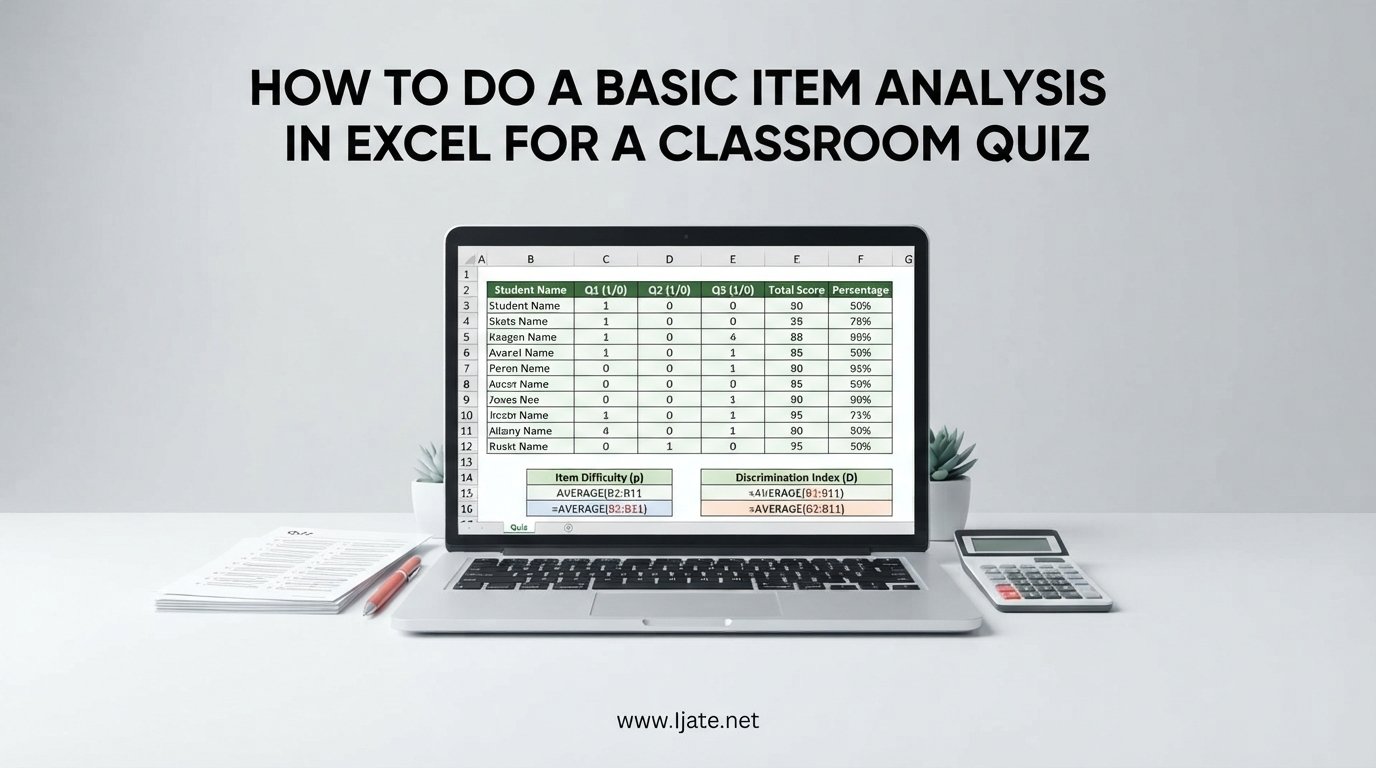
Every teacher has been there. You spend hours writing a quiz, administer it to 30 students, grade it, and then wonder which questions actually worked. Some questions everyone got right. Others everyone bombed. A few seemed to trip up your strongest students while weaker students nailed them. That confusion is exactly why item analysis exists, and learning how to do a basic item analysis in Excel for a classroom quiz changed how I write assessments.
Item analysis sounds like a statistics-heavy term, but it boils down to a simple idea: looking at how students responded to each question so you can judge whether that question is doing its job. You do not need a degree in psychometrics or expensive software. A standard Excel spreadsheet and a handful of basic formulas are enough to get meaningful, actionable results.
In this guide, I walk through the entire process from a blank spreadsheet to a finished report. I cover the four core components of item analysis, show the exact Excel formulas to use, and share interpretation tips I have picked up from running item analysis on my own classroom quizzes over the years. Everything here is built for teachers who want practical results without wading through statistical jargon.
Table of Contents
What Is Item Analysis?
Item analysis is a technique that evaluates the effectiveness of individual test questions by examining how students responded to each one. Instead of looking only at overall scores, you zoom in on a question-by-question level to see which items are pulling their weight and which are dragging the test down.
Think of it as a quality check for your quiz. A student’s total score tells you how much they know. Item analysis tells you how good your quiz was at measuring that knowledge. Without it, you are essentially trusting that every question you wrote is fair, clear, and useful, which is rarely true on the first pass.
The process produces two headline numbers for every question. The first is item difficulty, which is the proportion of students who answered correctly. The second is item discrimination, which measures how well the question separates students who truly understand the material from those who do not. Together, these numbers tell you whether a question is too easy, too hard, poorly worded, or working exactly as intended.
Teachers who run item analysis regularly tend to write better questions over time. You start spotting patterns. Maybe your true-or-false questions consistently have weak discrimination. Maybe certain multiple-choice distractors never get selected, which means they are not really distracting anyone. These insights compound, and your quizzes get sharper each semester.
The 4 Components of Item Analysis
When people talk about the components of item analysis, they are referring to four distinct lenses you can use to evaluate each question. Here are the four components of item analysis explained clearly:
1. Item Difficulty is the percentage of students who answered the question correctly. If 24 out of 30 students got it right, the difficulty index is 0.80. Most experts recommend aiming for a difficulty between 0.30 and 0.80 for multiple-choice questions on classroom tests.
2. Item Discrimination measures how well a question differentiates between high performers and low performers. A good question should be answered correctly more often by students who scored well overall. A negative or near-zero discrimination index signals a problem.
3. Distractor Analysis looks at the wrong answer choices on multiple-choice questions. A well-designed distractor should attract some students, particularly weaker ones. If nobody ever picks a particular distractor, it is not doing its job and should be rewritten.
4. Response Frequency is simply a count of how many students selected each answer option. This ties into distractor analysis but gives you the raw data. You can spot answer patterns, like everyone choosing option C on question 7, that might reveal a bias or a too-obvious correct answer.
These four components work together. Item difficulty tells you if the question is appropriately challenging. Item discrimination tells you if it measures real understanding. Distractor analysis and response frequency tell you if the wrong answers are doing their part. Skipping any one leaves you with an incomplete picture.
How to Do a Basic Item Analysis in Excel for a Classroom Quiz
This is the section most teachers search for, so I am going to walk through every step as if we are starting from a completely blank spreadsheet. I tested this exact process with a 10-question multiple-choice quiz given to 30 students, and I will reference that example throughout.
Before you start, have your quiz data ready. You need to know which answer is correct for each question, and you need each student’s response for each question. If you used a scantron or an online quiz tool that exports to CSV, you are already most of the way there.
Step 1: Set Up Your Excel Spreadsheet
Open a new Excel workbook and create a sheet called “Item Analysis.” Across the top row, starting in column A, type “Student,” then list each question number. So cell A1 says Student, B1 says Q1, C1 says Q2, and so on through your last question. In the final column, add a header called “Total Score.”
For a 10-question quiz, you will end up with 11 columns: one for the student name, ten for the questions, and one for the total. Leave a row or two of space below your headers before entering data, because you will need room for formula cells later.
Below your student data, create a small reference table. In this table, list each question number and the correct answer letter. This reference is what your formulas will check against. Keep it simple and clearly labeled so you can update it easily if you reuse the spreadsheet next semester.
Step 2: Enter Student Responses
Type each student’s name in column A and their answer for each question in the matching column. Use the answer letter, so if a student chose option B for question 1, type “B” in cell B2. This keeps things readable and matches how most teachers naturally record quiz responses.
Work through every student until all responses are entered. Double-check a few random cells against your source data, because a single mistyped letter will throw off your counts later. I learned this the hard way after spending an hour trying to figure out why my difficulty index for question 4 was 1.20, which is mathematically impossible.
If your quiz tool exported data as numbers instead of letters, you can adapt the formulas below to work with numbers. The logic stays the same; you are just counting how many responses match the correct answer.
Step 3: Score Each Response Using the IF Function
Create a second area of your spreadsheet, or a second sheet, where you convert each response into a 1 for correct or a 0 for incorrect. This binary conversion makes every downstream calculation simpler.
In the cell next to student 1’s response for question 1, enter this formula:
=IF(B2=$B$15,1,0)
Assuming your correct answer for question 1 is stored in cell B15, this formula checks whether the student’s response matches the correct answer. If it does, the cell shows 1. If not, it shows 0. The dollar signs lock the reference to your correct-answer cell so you can copy the formula down without Excel shifting the reference.
Copy this formula across all questions for all students. When you are done, you should have a grid of ones and zeros that mirrors your response grid. This is the data layer everything else builds on.
Step 4: Calculate Each Student’s Total Score
In the Total Score column of your binary grid, use the SUM function to add up each student’s correct answers. The formula looks like this:
=SUM(B2:K2)
This assumes your binary responses for student 1 are in columns B through K. Copy the formula down for every student. Now you have a total score for each student, which you will need for the discrimination calculation.
Take a moment to verify these totals against your original grading. If a student scored 8 on the quiz, their total in the binary grid should also be 8. Mismatches usually mean a formula error or a wrong correct-answer reference.
Step 5: Calculate Item Difficulty Using COUNTIF
Item difficulty is the proportion of students who answered each question correctly. Since your binary grid already has 1s for correct answers, this is a straightforward average.
In a row below your data, under question 1, enter:
=AVERAGE(B2:B31)
This divides the number of correct responses by the total number of students. If 24 out of 30 students answered correctly, the result is 0.80. Copy this formula across all question columns.
Alternatively, you can use COUNTIF against your original response grid:
=COUNTIF(B2:B31,$B$15)/COUNTA(A2:A31)
Both methods give you the same number. The AVERAGE approach on the binary grid is cleaner if you already built that layer.
Step 6: Calculate Item Discrimination Using Upper and Lower Groups
This is the step that intimidates teachers new to item analysis, but the logic is approachable. Item discrimination compares how well your top-performing students did on a question versus your bottom-performing students. The formula is:
Discrimination = (Correct in Upper Group - Correct in Lower Group) / (Half the Class)
First, sort your students by total score from highest to lowest. Select your entire data range, go to the Data tab, and use the Sort tool with Total Score as the sort column in descending order.
Identify your upper group as the top 27% of students and your lower group as the bottom 27%. For a class of 30, that is roughly the top 8 students and the bottom 8 students. The 27% cutoff comes from psychometric research that maximizes the sensitivity of the discrimination index, but rounding to the nearest whole student is fine for classroom purposes.
For each question, count how many students in the upper group answered correctly and how many in the lower group answered correctly. Using your binary grid and the COUNT or SUM function on those specific rows, the discrimination formula in Excel looks like this:
=(SUM(B2:B9)-SUM(B24:B31))/8
This assumes your upper group is in rows 2 through 9 and your lower group is in rows 24 through 31, with 8 students in each group. Copy the formula across all question columns to get a discrimination index for every item.
A discrimination index above 0.30 is generally considered good. Between 0.10 and 0.30 is acceptable but worth reviewing. Anything at or near zero means the question does not discriminate, and a negative value is a red flag that stronger students are getting it wrong while weaker students get it right.
Step 7: Run a Distractor Analysis
For each multiple-choice question, count how many students selected each answer option. This is where the COUNTIF function shines. For question 1, assuming the options are A, B, C, and D, enter:
=COUNTIF(B2:B31,"A")
Repeat for “B,” “C,” and “D.” Do this for every question. The goal is to confirm that every distractor, meaning every wrong answer, attracts at least a few students. A distractor chosen by zero students across the whole class is dead weight.
I always look for distractors that pull in high performers. If your strongest students are consistently choosing a particular wrong answer, that distractor might be too clever or the question itself might be ambiguous. Both situations are worth investigating.
Step 8: Review Response Frequencies for Patterns
Take a step back and look at your response frequency data as a whole. Are students gravitating toward one letter option more than others? Is the correct answer always in the same position? Position bias, where students guess toward the middle of the alphabet, is a real phenomenon that can inflate or deflate difficulty scores.
Scan for questions where the most popular answer was not the correct one. That is a strong signal that either the question is misleading or your instruction on that topic needs another look. I have rewritten entire lesson segments after item analysis revealed that the majority of the class held a consistent misconception.
Interpreting Your Results: What the Numbers Mean
Once your spreadsheet has item difficulty and item discrimination for every question, the next job is turning those numbers into decisions. Here is how I interpret the results from my own classroom quizzes.
Item Difficulty Guidelines: A difficulty index between 0.30 and 0.80 is the sweet spot for most classroom multiple-choice questions. Below 0.30 means the question is very hard, which might be fine for an advanced class but warrants a closer look. Above 0.80 means the question is easy, which is acceptable for foundational concepts but tells you little about who has truly mastered the material.
For a quiz where you want a mix of difficulty levels, aim for most questions in the 0.40 to 0.70 range with a few easier items at the start to build confidence and a few harder items at the end to stretch top performers.
Item Discrimination Guidelines: A discrimination index of 0.30 or higher indicates a strong item that effectively separates knowledgeable students from those still learning. Values between 0.10 and 0.30 suggest the question is acceptable but could be improved, possibly by tightening the wording or revising weak distractors. Anything at 0.10 or below is a candidate for revision or removal.
Negative discrimination is the most alarming result. It means your weaker students outperformed stronger students on that question, which usually points to a confusing question, an ambiguous correct answer, or a topic where stronger students overthink the item. Investigate immediately before reusing the question.
Distractor Health: Every wrong answer should attract at least 5% of students, ideally more. Distractors chosen by nobody offer no real measurement value. Rewrite or replace them with options that reflect common misconceptions.
Common Mistakes to Avoid
After running item analysis on dozens of my own quizzes, I have made just about every mistake possible. Here are the ones I see most often so you can sidestep them.
Using Too Small a Class Size. Item analysis works best with at least 20 students, and discrimination calculations really need 25 or more to be reliable. If you teach a small class, run the analysis but treat borderline results with extra caution.
Forgetting Absolute Cell References. When you copy formulas across question columns, forgetting the dollar signs in your correct-answer references will silently break your calculations. Always lock references to your answer key cells with F4 or by typing the dollar signs manually.
Skipping the Distractor Analysis. It is tempting to stop at difficulty and discrimination, but the distractor analysis is where the most actionable insights live. You cannot fix a weak question without knowing which wrong answers are pulling students off course.
Removing Questions Based on One Administration. A single bad result might be a fluke. If a question shows poor discrimination once, flag it. If it underperforms across two or three administrations, then revise or remove it.
Confusing Difficulty With Quality. A hard question is not automatically a bad question, and an easy question is not automatically a good one. Always pair difficulty with discrimination. A hard question that discriminates well is doing its job. An easy question that does not discriminate is just handing out free points.
FAQs
How to do an item analysis in Excel?
To do an item analysis in Excel, set up a spreadsheet with student responses, convert each response to 1 for correct or 0 for incorrect using the IF function, calculate item difficulty with AVERAGE, sort students by total score, and calculate item discrimination by comparing the top 27% to the bottom 27% of students. Add a distractor analysis using COUNTIF to count how many students chose each answer option.
What are the 4 components of item analysis?
The four components of item analysis are item difficulty (percentage answering correctly), item discrimination (how well a question separates strong from weak students), distractor analysis (effectiveness of wrong answer choices), and response frequency (how many students selected each option).
How to make item analysis in a test?
Item analysis in a test involves collecting student responses, scoring each item as correct or incorrect, calculating the difficulty index and discrimination index for every question, analyzing distractors, and interpreting the results to decide which questions to keep, revise, or remove.
How to do basic data analysis in Excel?
Basic data analysis in Excel uses functions like AVERAGE for means, COUNTIF for counting matching values, SUM for totals, IF for conditional logic, and the Sort tool for ranking. For item analysis specifically, these functions let you calculate difficulty, discrimination, and response frequencies from raw quiz data.
What is a good discrimination index value?
A discrimination index of 0.30 or higher is considered good, meaning the question effectively separates high performers from low performers. Values between 0.10 and 0.30 are acceptable but worth reviewing, and anything at or near zero or negative indicates the question needs revision.
What is the ideal item difficulty range for classroom quizzes?
For classroom multiple-choice quizzes, aim for an item difficulty between 0.30 and 0.80, with most questions in the 0.40 to 0.70 range. This balances challenge with accessibility and gives the most useful information about student understanding.
Conclusion
Learning how to do a basic item analysis in Excel for a classroom quiz is one of the highest-leverage skills a teacher can develop. The process takes a spreadsheet you already have, a few formulas you can copy and paste, and about 30 minutes after each quiz administration. What you get back is a clear, data-driven view of which questions are doing their job and which need work.
Start with the basics covered here: build your binary response grid, calculate item difficulty and item discrimination, run a distractor analysis, and interpret the numbers using the guidelines above. After two or three quizzes, the workflow becomes second nature and you will start catching weak questions before they reach your students.
Every time you revise a question based on item analysis data, your next quiz gets a little sharper. Over a school year, that compounds into assessments that genuinely reflect what your students know, which is the whole point of giving quizzes in the first place.