
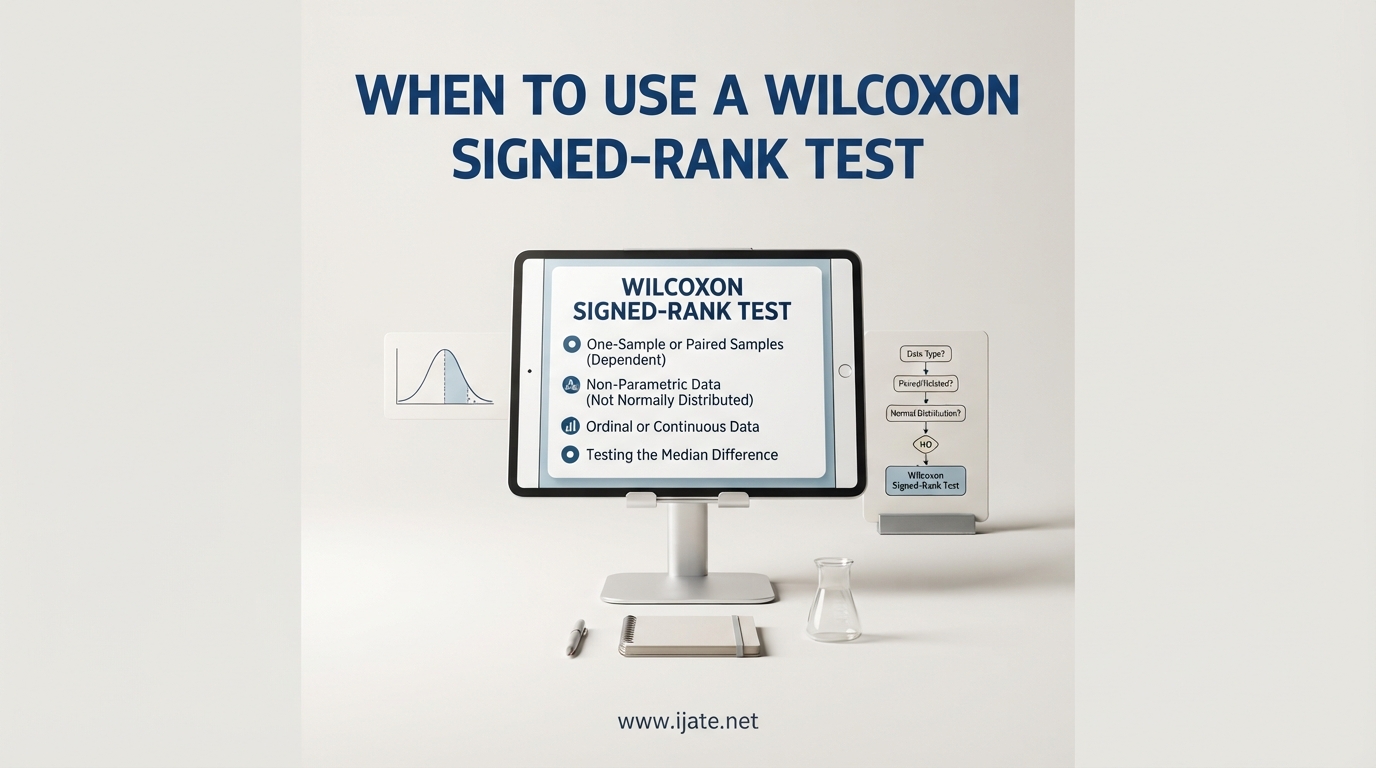
If you have ever run a paired t-test and watched your normality check fail, you have probably asked yourself when to use a Wilcoxon signed-rank test instead. You are in the right place. Our team has analyzed statistics textbooks, peer-reviewed papers, and hundreds of forum discussions from Reddit, StackExchange, and academic communities to build a guide that answers this question clearly and completely.
The Wilcoxon signed-rank test is a non-parametric alternative to the paired samples t-test, and it is one of the most widely used statistical tests in psychology, medicine, education, and business research. Yet many students and researchers struggle to know exactly when it applies, how it differs from similar tests like the Mann-Whitney U and the sign test, and how to interpret the results once they get them.
In this guide, we cover every condition, assumption, and comparison you need. We walk through a step-by-step numerical example, provide a reporting template in APA format, discuss effect sizes and sample size considerations, and address the common mistakes that trip people up. Whether you are writing a thesis, analyzing clinical trial data, or trying to make sense of Likert-scale survey responses, this article will help you make the right call with confidence.
Table of Contents
Quick Answer: When to Use a Wilcoxon Signed-Rank Test
Use the Wilcoxon signed-rank test when you have paired or dependent data (such as before-and-after measurements from the same participants) and your data violates the normality assumption required for a paired t-test. It tests whether the median difference between paired observations is significantly different from zero.
Here are the four primary scenarios where this test is the right choice:
- Non-normal data: Your paired differences are not normally distributed, often confirmed by a Shapiro-Wilk test or a visual inspection like a Q-Q plot.
- Ordinal data: Your measurements are on an ordinal scale, such as Likert-scale responses ranging from 1 (strongly disagree) to 5 (strongly agree).
- Outliers present: Your data contains extreme values that would distort the mean-based calculations of a parametric t-test.
- Small sample sizes: You have a small number of paired observations (typically fewer than 30), making it difficult to rely on the central limit theorem to rescue normality.
If any of these conditions describe your data, the Wilcoxon signed-rank test gives you a statistically valid way to compare paired groups without assuming a normal distribution.
What Is the Wilcoxon Signed-Rank Test?
The Wilcoxon signed-rank test is a non-parametric statistical test developed by Frank Wilcoxon in 1945. It evaluates whether two related, paired, or repeated-measures samples come from the same distribution. In plain terms, it answers this question: did scores change meaningfully between two time points or two conditions for the same group of people?
Think of it as the paired t-test’s non-parametric cousin. The paired t-test compares the mean difference between paired observations and assumes those differences follow a normal distribution. The Wilcoxon signed-rank test makes no such assumption. Instead of working with raw difference values, it ranks the absolute differences, assigns signs based on whether each difference is positive or negative, and then compares the sums of positive and negative ranks.
This ranking approach is what makes the test so versatile. Because it works with ranks rather than raw values, it is far less sensitive to outliers and skewed distributions. A difference of 50 points and a difference of 5 points might both end up as rank 1 and rank 2, depending on the data, so one extreme value cannot hijack the entire analysis.
The test produces a W-statistic (sometimes written as T or V depending on the software you use). Under the null hypothesis, the sum of positive ranks and the sum of negative ranks should be roughly equal. A large imbalance between them suggests a real directional shift in your data, which is exactly what you are testing for.
One important distinction: the Wilcoxon signed-rank test does not test whether the medians of the two groups are equal in the strictest sense. It tests whether the distribution of differences is symmetric around zero. In practice, researchers often describe the result as a comparison of central tendency, but the precise interpretation is about the symmetry of paired differences.
When to Use a Wilcoxon Signed-Rank Test: Key Conditions
Let us break down each condition in more detail so you can evaluate your own data with confidence.
Your Data Is Paired or Dependent
The most fundamental requirement is that your two sets of observations must be related. This means each data point in one group has a specific partner in the other group. Common paired designs include measuring the same participants before and after an intervention, matching participants on key characteristics, or measuring the same subjects under two different experimental conditions.
If your groups are independent (two separate groups of people with no pairing), you need the Mann-Whitney U test instead, not the Wilcoxon signed-rank test.
Your Differences Are Not Normally Distributed
This is the trigger condition for most researchers. You should always check the normality of your paired differences before deciding on a test. The standard approach is to run a Shapiro-Wilk test on the difference scores. If the result is significant (p less than 0.05), your differences deviate from normality, and the Wilcoxon signed-rank test becomes your best option.
Some researchers prefer visual methods over formal tests. A histogram or Q-Q plot of the difference scores can reveal skewness, heavy tails, or multimodality that a normality test might miss in small samples. We recommend using both approaches together for a thorough assessment.
You Are Working With Ordinal Data
Ordinal data presents a unique challenge. Likert-scale responses, rank-ordered preferences, and severity ratings carry order but not equal intervals. The difference between strongly agree and agree is not necessarily the same magnitude as the difference between neutral and disagree.
Parametric tests like the paired t-test assume interval or ratio data, where the spacing between values is meaningful and consistent. Applying them to ordinal data can produce misleading results. The Wilcoxon signed-rank test works naturally with ordinal data because it uses ranks rather than raw values, making it a better fit for survey research and rating-scale studies.
You Have Outliers That Distort the Mean
Outliers have a massive impact on parametric tests because means and standard deviations are sensitive to extreme values. A single participant whose score jumps from 10 to 200 can pull the mean difference far enough to produce a non-significant t-test result even when all other participants showed a clear, consistent change.
The Wilcoxon signed-rank test is much more robust to outliers. Because the test ranks differences by their absolute magnitude, the outlier becomes just the highest-ranked value rather than something that inflates the variance. The directional information is preserved through the sign, but the extreme magnitude is dampened.
You Have a Small Sample Size
Small samples (fewer than 30 paired observations) make it difficult to verify normality reliably. The central limit theorem, which lets us use parametric tests on non-normal data with large samples, requires roughly 30 or more observations to kick in effectively. Below that threshold, non-normal data can produce misleading t-test results.
The Wilcoxon signed-rank test works well with small samples because it does not rely on large-sample approximations. Software packages typically use exact distribution tables for small samples (usually up to about 15 to 20 pairs) and switch to a normal approximation with continuity correction for larger samples. This flexibility makes the test reliable across a wide range of sample sizes.
Assumptions of the Wilcoxon Signed-Rank Test
Although the Wilcoxon signed-rank test is non-parametric, it still has assumptions you must verify before using it. Failing to check these assumptions can lead to incorrect conclusions.
Assumption 1: The Dependent Variable Is Measured at Ordinal Level or Above
Your outcome variable must be measured on at least an ordinal scale. This includes Likert ratings, rank-ordered data, interval-level measurements like temperature in Celsius, and ratio-level measurements like reaction times or test scores. Nominal (categorical) data does not qualify because you cannot rank categories in a meaningful order.
Assumption 2: The Independent Variable Consists of Two Related Groups
Your two conditions must be paired or dependent. This means the same participants appear in both conditions, participants are matched on specific criteria, or the pairing is naturally occurring (such as left-hand and right-hand measurements from the same individuals).
Assumption 3: The Paired Observations Are Independently Sampled Within Each Group
While the two groups are related (paired), the individual pairs themselves should be independent of one another. One participant’s before-and-after scores should not influence another participant’s scores. If participants interact, share treatments, or cluster in groups (like students within the same classroom), you may violate this assumption and need a more complex model.
Assumption 4: The Distribution of Differences Is Symmetric
This is the assumption that catches the most people off guard. The Wilcoxon signed-rank test does not require your raw data to be normally distributed, but it does require the distribution of the difference scores to be approximately symmetric. If your differences are heavily skewed in one direction, the test results may be unreliable.
How do you check this? Create a histogram of your difference scores and look for rough left-right balance. You can also use a Shapiro-Wilk test on the differences, which simultaneously checks for normality and symmetry issues. If the symmetry assumption is violated, consider a data transformation or the sign test, which makes no symmetry assumption but has less statistical power.
Assumption 5: Differences Are Continuous (No Heavy Ties)
Ideally, the difference values should be continuous enough that tied differences are rare. When many differences share the same absolute value, the test must assign average ranks to ties, which slightly reduces accuracy. In practice, most software handles ties with correction methods, but if a large fraction of your differences are identical, you may want to consider the sign test instead.
Hypotheses: Null and Alternative
Understanding the hypotheses is essential because it determines how you interpret your results and which tail of the test you should use.
Null Hypothesis (H0)
The null hypothesis states that the median difference between paired observations equals zero. In formal terms, the distribution of differences is symmetric around zero, meaning positive and negative changes balance out. There is no systematic shift between the two conditions.
Alternative Hypothesis (H1) for a Two-Tailed Test
The alternative hypothesis states that the median difference is not equal to zero. The distribution of differences is not symmetric around zero, meaning there is a systematic shift in one direction or the other. This is the most common form used in research.
Alternative Hypothesis (H1) for a One-Tailed Test
If you have a strong directional prediction before collecting data, you can use a one-tailed test. The alternative hypothesis states that the median difference is either strictly greater than zero or strictly less than zero, depending on your prediction. One-tailed tests have more power but require pre-registration of the direction. You cannot decide to use a one-tailed test after seeing the data.
Step-by-Step: How the Test Works
Understanding the mechanics helps you interpret results correctly and explain them to others. Here is the procedure broken down into clear steps.
Step 1: Calculate the difference for each pair. Subtract the second measurement from the first for each participant. Record both the magnitude and the sign (positive or negative).
Step 2: Remove zero differences. If any participant had identical scores in both conditions, their difference is zero. These pairs are excluded from the analysis because they provide no directional information.
Step 3: Rank the absolute differences. Ignore the signs for now. Rank all the absolute difference values from smallest to largest. The smallest absolute difference gets rank 1, the next smallest gets rank 2, and so on. If two or more differences tie, assign each the average of the ranks they would have occupied.
Step 4: Reattach the signs. Go back to each rank and note whether the original difference was positive or negative. Mark each rank accordingly.
Step 5: Sum the positive and negative ranks separately. Add up all ranks with positive signs to get W+. Add up all ranks with negative signs to get W-. The test statistic W is the smaller of these two sums (though some software reports both or uses a different convention).
Step 6: Determine significance. For small samples, compare W to critical values from a Wilcoxon signed-rank table. For larger samples (typically 15 to 20 pairs or more), the software converts W to a z-score using a normal approximation with continuity correction and reports a p-value.
Step 7: Interpret. If the p-value is below your chosen significance level (commonly 0.05), reject the null hypothesis. There is a statistically significant difference between your paired conditions.
Wilcoxon vs Paired t-Test: When to Choose Which
This is one of the most frequently asked questions on statistics forums. The decision comes down to your data characteristics and the assumptions you can defend.
Use the paired t-test when your paired differences are approximately normally distributed, your data is measured on an interval or ratio scale, and you have a reasonable sample size (typically 30 or more pairs). The t-test has more statistical power than the Wilcoxon signed-rank test, meaning it is more likely to detect a real effect when one exists.
Switch to the Wilcoxon signed-rank test when your differences fail a normality test (Shapiro-Wilk p less than 0.05), your data is ordinal (such as Likert scales), you have significant outliers that distort the mean, or your sample is too small to reliably assess normality.
A common mistake is defaulting to Wilcoxon to avoid checking normality altogether. Forum communities on Reddit and StackExchange consistently advise against this. If your data meets parametric assumptions, the t-test will give you tighter confidence intervals and more precise estimates. Saving the Wilcoxon signed-rank test for when it is genuinely needed is the methodologically sound approach.
Another key difference: the t-test compares means, while the Wilcoxon signed-rank test compares the distribution of differences. If you need to make specific claims about mean differences (for example, the average score increased by 5 points), the t-test is your tool. The Wilcoxon signed-rank test can tell you the direction and significance of the shift but not the precise magnitude in original units.
Wilcoxon vs Mann-Whitney U Test: Key Differences
The confusion between these two tests is widespread, and it comes down to one fundamental distinction: paired versus independent samples.
The Wilcoxon signed-rank test is for paired or dependent data. The same participants (or matched pairs) appear in both groups. You are measuring whether scores changed within the same subjects.
The Mann-Whitney U test (also called the Wilcoxon rank-sum test) is for independent data. Two completely separate groups of participants are compared, with no pairing or matching. You are testing whether one group tends to have higher values than the other.
Here is a quick comparison:
- Data structure: Wilcoxon uses paired observations. Mann-Whitney uses two independent groups.
- Question answered: Wilcoxon asks whether scores changed for the same subjects. Mann-Whitney asks whether one group differs from another.
- Example: Use Wilcoxon to compare anxiety scores before and after therapy for the same patients. Use Mann-Whitney to compare anxiety scores between a treatment group and a separate control group.
- Parametric counterpart: Wilcoxon corresponds to the paired t-test. Mann-Whitney corresponds to the independent samples t-test.
If you accidentally use Mann-Whitney on paired data, you lose the power that comes from the within-subjects design. If you accidentally use Wilcoxon on independent groups, your results are meaningless because there is no valid pairing structure.
Wilcoxon vs Kruskal-Wallis: When to Choose Which
The distinction here is about the number of groups you are comparing.
The Wilcoxon signed-rank test compares exactly two related groups. If you have three or more related groups (for example, measuring the same participants at three time points), you need the Friedman test instead.
The Kruskal-Wallis test compares three or more independent groups. It is the non-parametric counterpart to a one-way ANOVA. Use it when you want to compare outcomes across three or more separate, unrelated groups.
Think of it this way: two groups and paired data means Wilcoxon signed-rank. Three or more groups and independent data means Kruskal-Wallis. Three or more groups and paired data means Friedman. Two groups and independent data means Mann-Whitney U.
Wilcoxon vs Sign Test: Why Wilcoxon Is Often Better
Both tests work with paired data and both are non-parametric, but they use information differently.
The sign test only looks at the direction of each difference (positive or negative). It ignores the magnitude entirely. This makes it extremely simple but also less powerful because it discards information about how large each change is.
The Wilcoxon signed-rank test uses both the direction and the ranked magnitude of each difference. By incorporating how much each value changed, it achieves greater statistical power than the sign test. As noted in ScienceDirect’s overview, whenever your data consists of definite scores rather than just directional outcomes, the Wilcoxon signed-rank test is preferred.
Use the sign test when your data can only be classified as improved or not improved (binary directional data), or when the symmetry assumption of the Wilcoxon signed-rank test is violated and no transformation fixes it. In those narrow cases, the sign test is the safer choice.
One-Tailed vs Two-Tailed Testing
No competitor in our analysis covers this topic, yet it is one of the most frequently asked questions about the Wilcoxon signed-rank test. Let us fix that gap.
A two-tailed test is the default and the safer choice for most research. You are testing whether the paired scores differ in either direction without specifying which way. Your alternative hypothesis is that the median difference is not zero, in either direction. This is appropriate when you want to detect any meaningful change, regardless of whether it is an increase or decrease.
A one-tailed test is appropriate only when you have a strong theoretical reason to expect change in one specific direction before you collect data. For example, if you are testing a medication designed to reduce pain scores, you might predict that post-treatment scores will be lower than pre-treatment scores. Your alternative hypothesis is directional: the median difference is strictly less than zero (or strictly greater, depending on subtraction order).
The one-tailed test has more statistical power because all the alpha probability is concentrated on one side of the distribution. However, this comes with a critical limitation. If the effect goes in the opposite direction from your prediction, you cannot claim significance, no matter how strong the effect is. You committed to one direction before seeing the data.
Most reviewers and committees expect two-tailed tests unless you can provide a compelling justification for going one-tailed. If you are unsure, use two-tailed. It is the conservative, defensible choice.
In software, the choice is usually a parameter. In R, set the alternative argument to two.sided, greater, or less. In SPSS, the test is two-tailed by default, but you can request a one-tailed version in the dialog options. In Python (SciPy), use the alternative parameter in scipy.stats.wilcoxon.
Real-World Examples Across Disciplines
Abstract explanations only go so far. Let us look at how the Wilcoxon signed-rank test plays out in different fields.
Psychology: Anxiety Scores Before and After Therapy
A clinical psychologist measures anxiety levels in 18 patients using a standardized scale before and after a 12-week cognitive behavioral therapy program. The difference scores are heavily right-skewed because two patients showed dramatic improvement while others showed modest gains. A Shapiro-Wilk test on the differences returns p equals 0.01, violating normality. The psychologist uses the Wilcoxon signed-rank test and finds a significant decrease in anxiety (W equals 22, p equals 0.003), confirming the therapy program is effective.
Medicine: Pain Levels Before and After Medication
Researchers compare visual analog scale pain ratings for 24 patients before and one hour after receiving a new analgesic. Pain ratings are ordinal and bounded between 0 and 10. The data has several tied values at common pain levels. The Wilcoxon signed-rank test with tied-rank correction shows a significant reduction in pain (z equals negative 3.8, p less than 0.001), supporting the drug’s effectiveness.
Business: Customer Complaints Before and After Training
A retail company trains its customer service team on de-escalation techniques. They count weekly customer complaints for 12 stores in the month before training and the month after. Complaint counts are count data with a skewed distribution and two outlier stores with unusually high complaint volumes. The Wilcoxon signed-rank test reveals a significant reduction in complaints (W equals 15, p equals 0.02), demonstrating the training had a measurable impact despite the outliers.
Education: Test Scores With and Without a New Teaching Method
A school district pilots a new reading curriculum. They administer the same standardized reading assessment to 30 students before and after the 9-week pilot. Several students show extreme gains that pull the distribution of differences away from normality. Rather than forcing a t-test on non-normal data, the researchers use the Wilcoxon signed-rank test and report a significant improvement (z equals 2.9, p equals 0.004, effect size r equals 0.37), which they interpret as a medium effect.
Technology: Battery Life Before and After a Software Update
A tech company measures battery drain on 20 devices running the same video playback benchmark before and after a firmware update. Battery drain times have a non-normal distribution with a long left tail. The Wilcoxon signed-rank test detects no significant difference (W equals 89, p equals 0.54), providing evidence that the update did not meaningfully affect battery performance.
Effect Size and Interpretation
A significant p-value tells you that a difference exists. It does not tell you how large or meaningful that difference is. For that, you need an effect size measure.
For the Wilcoxon signed-rank test, the most commonly reported effect size is r, calculated by dividing the z-statistic by the square root of the total number of observations (the number of non-zero pairs). The formula is r equals z divided by the square root of N.
Here is how to interpret r using guidelines adapted from Cohen (1988):
- r less than 0.1: Negligible effect. The difference exists statistically but is trivially small in practical terms.
- r of 0.1 to 0.29: Small effect. The difference is detectable but may not be practically meaningful depending on context.
- r of 0.3 to 0.49: Medium effect. The difference is moderate and likely noticeable in real-world settings.
- r of 0.5 or greater: Large effect. The difference is substantial and clearly meaningful in practice.
Always report the effect size alongside your p-value. Reviewers, committees, and journal editors increasingly expect it because p-values alone can be misleading, especially with larger sample sizes where even tiny effects become statistically significant.
Sample Size and Power Considerations
One question we see repeatedly on forums is how many paired observations are needed for reliable Wilcoxon signed-rank results. The answer depends on the effect size you are trying to detect.
The Wilcoxon signed-rank test has about 95% of the statistical power of a paired t-test when the normality assumption holds. This means if the paired t-test requires 20 pairs to detect a medium effect at 80% power, the Wilcoxon signed-rank test would need approximately 21 pairs for the same result. The power loss is minimal, which is reassuring.
For small samples (under 15 pairs), most software uses exact critical value tables rather than the normal approximation. This is the preferred approach because the normal approximation can be inaccurate for very small samples. If your software does not distinguish between exact and approximate methods, check the documentation.
For large samples (above 20 to 25 pairs), the normal approximation with continuity correction is standard. The z-score output becomes reliable at this point. Some packages apply a variance correction for ties automatically, which improves accuracy when your data has many repeated values.
If you are planning a study and want to know whether Wilcoxon is feasible, a power analysis using G*Power or similar tools can estimate the required sample size. Select the Wilcoxon signed-rank test option, input your expected effect size and desired power (typically 0.80), and the tool will return the minimum number of pairs needed.
Common Mistakes and How to Avoid Them
Our research into forum discussions revealed several recurring mistakes. Here are the top pitfalls and how to steer clear of them.
Mistake 1: Using Wilcoxon on independent groups. If your two groups have no natural pairing (different people in each group), you need the Mann-Whitney U test. Check your study design before selecting a test. This error produces completely invalid results.
Mistake 2: Ignoring the symmetry assumption. The Wilcoxon signed-rank test assumes the distribution of differences is symmetric, even though it does not assume normality. Always plot a histogram of your difference scores. If the distribution is heavily skewed, try a transformation first or fall back to the sign test.
Mistake 3: Not checking normality first. Defaulting to Wilcoxon without testing whether a t-test would work costs you statistical power for no reason. Run a Shapiro-Wilk test on your differences. If normality holds, use the paired t-test.
Mistake 4: Confusing Wilcoxon signed-rank with Wilcoxon rank-sum. These are two different tests. The signed-rank test is for paired data. The rank-sum test is another name for the Mann-Whitney U test and is for independent groups. The naming overlap causes endless confusion.
Mistake 5: Failing to report effect sizes. Reporting only the W-statistic and p-value is incomplete. Always include an effect size measure (typically r) so readers can judge the practical significance of your findings, not just the statistical significance.
Mistake 6: Switching to one-tailed after seeing the data. This is p-hacking. If you did not pre-register a directional prediction, you must use a two-tailed test. Changing your analysis plan based on the observed direction inflates your false-positive rate.
Mistake 7: Forgetting to remove zero differences. Participants with identical scores in both conditions contribute no information. Most software handles this automatically, but if you are calculating manually or using an unfamiliar tool, verify that zero-difference pairs are excluded before ranking.
Reporting Results: APA Format Template
Once you have your results, reporting them clearly matters as much as the analysis itself. Here is an APA-style template you can adapt.
A Wilcoxon signed-rank test showed that [post-treatment scores] were statistically significantly [higher/lower] than [pre-treatment scores], [z or W value] = [value], p = [value], r = [effect size].
Here is a filled-in example based on the psychology case above:
A Wilcoxon signed-rank test showed that post-therapy anxiety scores were statistically significantly lower than pre-therapy anxiety scores, z = 3.12, p = .003, r = .52.
Include the test statistic, exact p-value (reported to three decimal places, or as p less than .001 for very small values), and the effect size. Some journals also expect a 95% confidence interval for the effect size, which you can calculate using bootstrapping or specialized software.
Frequently Asked Questions
Why use Wilcoxon instead of t-test?
Use the Wilcoxon signed-rank test instead of a paired t-test when your paired difference scores are not normally distributed, when you have ordinal data like Likert scales, or when outliers are present that would distort the mean. The t-test has more statistical power when normality holds, so only switch to Wilcoxon when the assumptions of the t-test are genuinely violated.
Under what conditions might one use the Wilcoxon signed ranks test?
Use the Wilcoxon signed-rank test under four main conditions: (1) your data is paired or dependent, meaning the same participants are measured twice, (2) the distribution of difference scores is not normal, confirmed by a Shapiro-Wilk test, (3) your measurements are on an ordinal scale such as a Likert rating, or (4) your sample is small (fewer than 30 pairs) and normality cannot be reliably assessed.
When to use Wilcoxon vs Mann Whitney?
Use the Wilcoxon signed-rank test when your two groups are paired or dependent (the same participants measured under two conditions). Use the Mann-Whitney U test when your two groups are independent (two separate groups of different participants with no pairing). Wilcoxon is the non-parametric counterpart to the paired t-test, while Mann-Whitney is the non-parametric counterpart to the independent samples t-test.
When to use Wilcoxon vs Kruskal Wallis?
Use the Wilcoxon signed-rank test when comparing two related or paired groups. Use the Kruskal-Wallis test when comparing three or more independent groups. If you have three or more related groups (such as the same participants measured at three time points), use the Friedman test instead. The number of groups and whether they are paired or independent determines which test is appropriate.
Conclusion
Knowing when to use a Wilcoxon signed-rank test comes down to three questions. Are your observations paired? Are your differences non-normal, ordinal, or affected by outliers? Is the distribution of your differences approximately symmetric? If you answered yes to all three, the Wilcoxon signed-rank test is the right tool for your analysis.
Remember that this test is not a fallback or a concession. It is a deliberate, well-powered statistical method that has been used in published research for over 80 years since Frank Wilcoxon first described it in 1945. Choosing it when your data demands it shows methodological awareness, not a lack of alternatives.
Start by checking your assumptions. Run a Shapiro-Wilk test on your difference scores, plot a histogram, and look for outliers. If the parametric path is open, take it. If not, the Wilcoxon signed-rank test will serve you well. Report your results with the test statistic, p-value, and effect size in APA format, and you will have an analysis that stands up to review.