
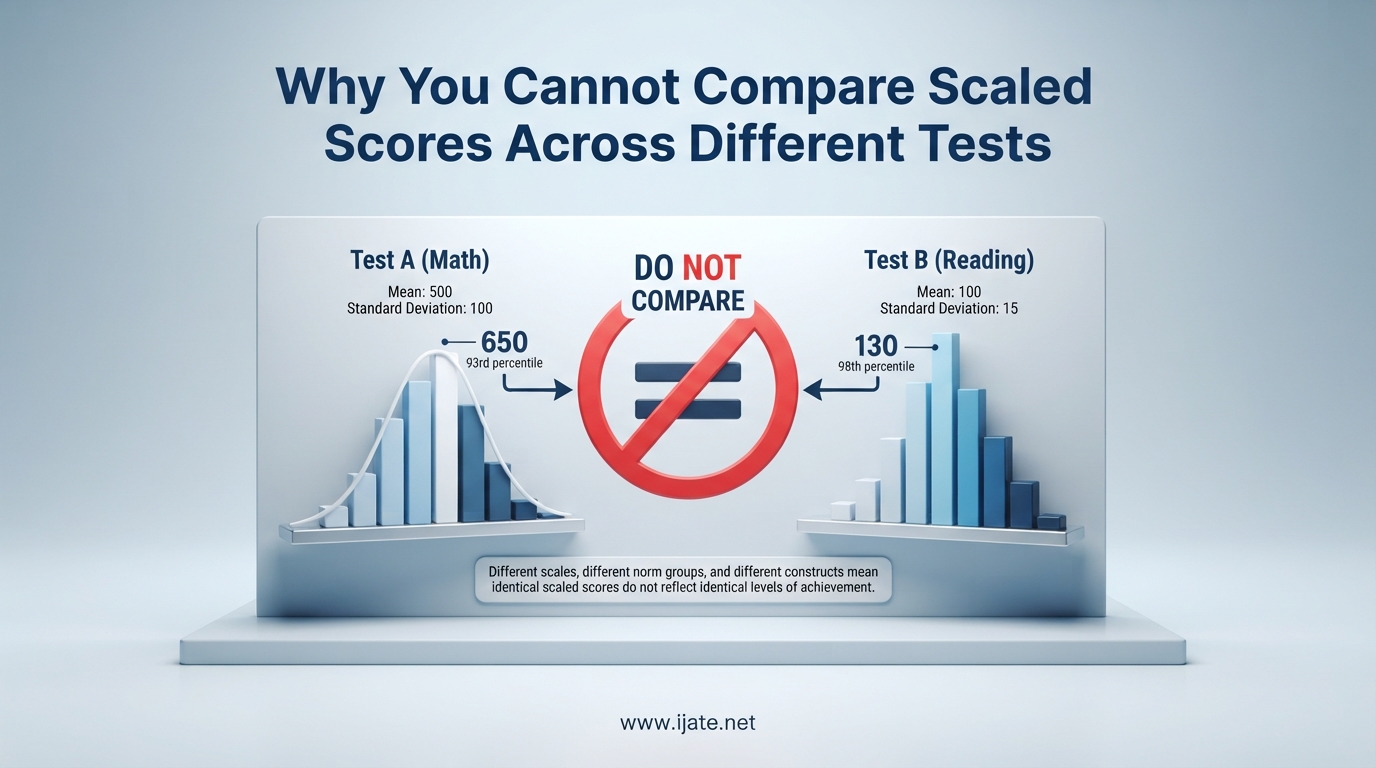
A student scores 650 on the SAT Math section and 27 on the ACT Math section. Which performance is stronger? If you are tempted to just glance at the numbers and pick the higher one, you have already run into the fundamental problem we are addressing here. You cannot compare scaled scores across different tests because each testing program builds its own unique scale, its own statistical transformation process, and its own reference population.
This is one of the most common sources of confusion I see among students, parents, and even educators. People treat scaled scores as if they are universal currency, assuming a 500 on one exam carries the same meaning as a 500 on another. That assumption breaks the moment you understand how scaled scoring actually works behind the scenes.
In this article, I will walk through what scaled scores are, why raw scores cannot be compared across test forms, how the equating process works, and why z-scores offer a bridge for cross-test comparison. I will also cover the difference between criterion-referenced and norm-referenced interpretation, and use the SAT versus ACT comparison as a concrete example of why you cannot directly compare scaled scores across different tests.
Table of Contents
What Are Scaled Scores and Why Do They Exist
A scaled score is a mathematically transformed version of a raw test score that has been adjusted to account for differences in test difficulty. Testing programs do not report raw scores (the number of items you answered correctly) because raw scores are misleading without context. Instead, they convert raw scores onto a standardized scale that stays consistent from one test administration to the next.
Here is why scaled scores exist in the first place. Every major testing organization produces multiple versions of their test, called test forms. The SAT, for example, is administered several times per year, and each administration uses a different form with different questions. Even with careful test design, some forms will be slightly harder or easier than others.
If the testing program reported raw scores, students taking a harder form would be penalized unfairly. A student who answered 48 out of 60 questions correctly on a difficult form might actually demonstrate more ability than a student who answered 50 out of 60 on an easier form. Scaled scores fix this problem by applying research on passing score determination and statistical adjustments that level the playing field.
Think of it this way: a scaled score is a translation of your raw performance into a common language that the testing program uses internally. The scale itself is arbitrary. The SAT chose a 200 to 800 range per section. The ACT chose 1 to 36. The GRE chose 130 to 170. These ranges are convenient and recognizable, but they are not mathematically connected to each other in any way.
Why Raw Scores Cannot Be Compared Across Different Test Forms
To understand why you cannot compare scaled scores across different tests, you first need to understand why raw scores cannot even be compared across different forms of the same test. This is the foundational problem that scaled scoring was invented to solve.
A raw score is simply the count of correct answers. If you got 45 questions right on a 50-question math test, your raw score is 45. That number seems straightforward, but it hides a critical variable: the difficulty of those specific 50 questions.
Imagine two versions of a 50-question algebra test. Form A contains mostly linear equations and basic factoring. Form B includes complex polynomial division, systems of inequalities, and advanced word problems. Getting 40 correct on Form A demonstrates a different level of algebraic proficiency than getting 40 correct on Form B. The raw scores look identical, but they represent different amounts of demonstrated skill.
Testing organizations solve this within their own exams through a process called equating, which I will explain next. But here is the key insight: equating only works within a single testing program. The statistical machinery that converts a raw SAT score to a scaled SAT score has no connection whatsoever to the machinery that converts a raw ACT score to a scaled ACT score. They are entirely separate systems built by separate organizations using separate reference populations.
This is why a raw score of 40 on the SAT Math section and a raw score of 40 on the ACT Math section tell you nothing useful when compared directly. The tests measure overlapping but not identical content, use different question types, weight item difficulty differently, and were built on completely separate statistical foundations. The same logic extends to scaled scores: a 650 on SAT Math and a 27 on ACT Math exist on different measurement scales entirely.
One common question I see in forums is why a student might get a lower scaled score despite answering more questions correctly than last time. This happens when the second test form was easier overall. More correct answers on an easier form can produce the same or lower scaled score than fewer correct answers on a harder form. The equating process ensures the scaled score represents the same ability level, not the same number of correct answers.
The Statistical Equating Process Explained
Equating is the statistical procedure that converts raw scores to scaled scores in a way that makes scores comparable across different test forms within the same testing program. It is the mathematical backbone of score comparability, and understanding it helps clarify why the comparison breaks down when you cross from one testing program to another.
Here is a simplified version of how equating works in practice. Testing organizations embed a set of anchor items (also called common items or equating items) into each new test form. These are questions that have appeared on previous forms and whose statistical properties are already well understood from prior administrations. By comparing how candidates perform on these anchor items relative to the new items, psychometricians can estimate the difficulty of the new form.
The equating process generally follows these steps:
Step 1: Administer the new test form with embedded anchor items that have known difficulty parameters based on test item difficulty analysis.
Step 2: Compare performance on the anchor items to historical data. If candidates are scoring higher on anchor items than past groups did, the new form’s raw scores need to be adjusted downward to account for a potentially more capable group or an easier new form.
Step 3: Apply a statistical transformation, often based on Item Response Theory (IRT) or classical equipercentile equating, that maps raw scores onto the established scaled score range. This involves statistical adjustment methods in educational testing that account for both the difficulty of the form and the ability distribution of the test-taking population.
Step 4: Validate the equating results to ensure that a given scaled score on the new form represents the same ability level as that same scaled score on previous forms.
The critical point is this: equating creates a closed system. The SAT equating process makes SAT scores comparable to other SAT scores. The ACT equating process makes ACT scores comparable to other ACT scores. But there is no equating link between the SAT and ACT. They share no anchor items, no common scale, and no shared reference population. This is the fundamental statistical reason why you cannot compare scaled scores across different tests.
Equating also produces a standard error of measurement (SEM) for each scaled score. The SEM tells you how much a student’s observed score might fluctuate due to random factors. A scaled score of 520 might have an SEM of plus or minus 15 points, meaning the student’s true ability level likely falls somewhere in that range. But again, the SEM is specific to each test’s own scale and cannot bridge the gap to a different test’s scale.
Z-Scores: The Common Language for Comparing Different Distributions
If scaled scores cannot be compared across tests, is there any way to compare performance on different assessments? Statistically, yes, and the answer lies in z-scores. A z-score is a type of standard score that expresses how many standard deviations a particular score is above or below the mean of its distribution.
The z-score formula is straightforward:
z = (X – mean) / standard deviation
Where X is the raw score, the mean is the average score of the reference population, and the standard deviation measures how spread out the scores are. The beauty of z-scores is that they convert any score from any distribution onto a universal scale where 0 represents the mean, 1 represents one standard deviation above the mean, and -1 represents one standard deviation below.
This is why z-scores can be used to compare scores from different distributions with one another. If you score 1.5 standard deviations above the mean on Test A and 0.8 standard deviations above the mean on Test B, you can confidently say your relative performance was stronger on Test A, even though Test A and Test B use completely different raw score scales and measure different content.
Z-scores connect to measurement theory in educational assessment through the normal distribution. When scores follow a normal distribution (the classic bell curve), z-scores map directly to percentile ranks. A z-score of 0 corresponds to the 50th percentile. A z-score of 1 corresponds to roughly the 84th percentile. A z-score of -1 corresponds to roughly the 16th percentile.
Several other standard score types are built on the z-score foundation:
T-scores transform z-scores to a scale with a mean of 50 and a standard deviation of 10. A T-score of 60 means the same thing as a z-score of 1: one standard deviation above the mean. T-scores are commonly used in psychological and educational testing because they avoid negative numbers.
Stanine scores (short for “standard nine”) divide the normal distribution into nine bands, with stanine 5 representing the average range and stanines 1 and 9 representing the extremes. Stanines provide a simplified way to communicate performance categories.
Sten scores (standard ten) use a similar approach with a 10-point scale, a mean of 5.5, and a standard deviation of 2.
These are all standard scores, and they all share the same advantage: they express performance relative to a reference group in a way that is comparable across distributions. But here is the catch: to compute a z-score or any standard score, you need to know the mean and standard deviation of the specific reference population for that test. Testing programs do not always publish this data, and even when they do, comparing z-scores across tests tells you about relative standing within each test’s population, not about absolute mastery of content.
Criterion-Referenced vs Norm-Referenced Score Interpretation
Another reason you cannot compare scaled scores across different tests is that tests are designed for different interpretive purposes. Some tests are criterion-referenced, meaning scores are interpreted relative to a fixed standard of knowledge or skill. Others are norm-referenced, meaning scores are interpreted relative to the performance of other test takers.
A criterion-referenced score tells you what a student can do. A state math test might report that a student scored at a “proficient” performance level, meaning the student demonstrated mastery of the specific math skills defined by the state’s academic standards. The scaled score on a criterion-referenced test is tied to cut scores that separate performance categories like “below basic,” “basic,” “proficient,” and “advanced.”
A norm-referenced score tells you how a student compares to others. The SAT and ACT are primarily norm-referenced. A score of 650 on SAT Math means you performed better than a certain percentage of the reference population, not that you mastered a specific list of math skills.
Comparing a scaled score from a criterion-referenced state test to a scaled score from a norm-referenced admissions test is like comparing degrees Fahrenheit to a wind chill index. Both are numbers, and both describe temperature in some sense, but they measure fundamentally different things using different logic.
Percentile ranks are often confused with scaled scores, but they are also not comparable across tests. A percentile rank of 85 on Test A means the student outperformed 85 percent of Test A’s reference population. A percentile rank of 85 on Test B means the student outperformed 85 percent of Test B’s reference population. If the two populations have different ability distributions, the two percentile ranks represent different absolute levels of performance. Percentile ranks normalize for population differences within a single test but do not create comparability between tests.
Real-World Example: SAT vs ACT Score Comparison
The SAT versus ACT comparison is the most common real-world scenario where people try to compare scaled scores across different tests. Both are college admissions exams. Both measure reading, writing, and math skills. Both are taken by millions of high school students each year. But their scaled scores live on entirely different scales with no direct mathematical connection.
The SAT reports a total score ranging from 400 to 1600, combining two section scores (Math and Reading and Writing) each ranging from 200 to 800. The ACT reports a composite score ranging from 1 to 36, averaging four subject test scores (English, Math, Reading, and Science) each ranging from 1 to 36.
A student might score 1250 on the SAT and 27 on the ACT. Which is better? You cannot tell by looking at the numbers, because the scales have different ranges, different reference populations, and different statistical foundations. The SAT scale was designed with a mean near 1000 and a standard deviation of roughly 200. The ACT scale was designed with a mean near 20.8 and a standard deviation of roughly 4.7. These are independent statistical constructions.
So how do colleges compare SAT and ACT scores? They use concordance tables, which are empirically derived lookup tables that map scores from one test to scores on the other based on the performance of students who took both exams. The College Board and ACT jointly publish concordance tables that allow rough cross-test comparison.
But concordance is not the same as equivalency. A concordance table tells you that an SAT score of 1220 and an ACT score of 27 correspond to similar percentile ranks in their respective populations. It does not mean the scores measure identical constructs or that the same student would necessarily earn both scores. Concordance tables are statistical approximations based on group data, and they are updated periodically as the tests and their populations change.
Other tests present the same problem. The GRE reports scores from 130 to 170 per section. State accountability tests use their own unique scales, often ranging from 100 to 800 or similar ranges. Differential item functioning analysis shows that test items often perform differently across demographic groups, adding another layer of complexity to cross-test score comparison.
The bottom line for SAT versus ACT: you cannot directly compare a 650 to a 27, or even a 1250 to a 27, without a concordance table. And even with a concordance table, the comparison is approximate and population-dependent, not a precise mathematical equivalency.
Common Misconceptions About Scaled Scores
In my research for this article, I spent time reading forum discussions on Reddit, teacher communities, and test preparation sites. Several misconceptions about scaled scores come up repeatedly, and they all stem from the same root cause: treating scaled scores as universal measurements rather than test-specific constructions.
Misconception 1: “A higher scaled score always means more correct answers.” This is false because of equating. On an easier test form, you may need more correct answers to achieve the same scaled score as you would on a harder form. A student’s scaled score can even go down while their raw score goes up if the second form was significantly easier. This is not a flaw in the system; it is the system working as designed to maintain score comparability across forms.
Misconception 2: “A 500 on one test equals a 500 on another test.” This is false because scaled score ranges are arbitrary constructions chosen by each testing organization. A 500 on the SAT means something entirely different from a 500 on a state accountability test or a professional certification exam. The number 500 has no universal meaning in testing.
Misconception 3: “Scaled scores are just percentages in disguise.” This is false and particularly dangerous. A scaled score of 700 on the SAT does not mean 70 percent correct, and it definitely does not mean the same thing as 70 percent on a classroom quiz. Scaled scores incorporate difficulty adjustments, equating transformations, and population-based scaling that have nothing to do with percentage correct.
Misconception 4: “If the test reports percent correct, I can compare that across tests.” Even percent correct is not comparable across tests of different difficulty. Getting 75 percent correct on an easy test is not the same achievement as getting 75 percent correct on a hard test. This is exactly why testing programs moved to scaled scores in the first place.
One parent I came across in a forum was anxious because their child’s STAR assessment scaled score seemed to drop from one grade level to the next. The scores looked lower, but the child had moved to a different test with a different scale range. The numbers were not comparable. This kind of confusion is widespread and understandable, but it reinforces why understanding the limits of score comparability matters in practice.
FAQs
What is the difference between scaled scores and standard scores?
A scaled score is specific to a particular testing program and is designed to make scores comparable across different forms of that same test. A standard score (such as a z-score, T-score, or stanine) expresses performance relative to a distribution’s mean and standard deviation, making it theoretically comparable across different distributions. Scaled scores are test-specific while standard scores use a universal statistical framework.
Why is a z-score a standard score and why can z-scores be used to compare scores from different distributions?
A z-score is a standard score because it expresses how many standard deviations a value is from its distribution mean. Since all z-scores use the same unit (standard deviations from the mean), they convert any score from any normal distribution onto a common scale. A z-score of 1.5 means the same thing whether it comes from Test A or Test B: one and a half standard deviations above that distribution’s mean.
What is the difference between scaling and scoring?
Scoring is the process of determining how many questions a test taker answered correctly, producing a raw score. Scaling is the statistical process of converting that raw score onto a standardized scale that accounts for test difficulty differences. Scoring happens first, then scaling transforms the score for fair reporting and comparison within a testing program.
Are scaled scores and standard scores the same?
No, scaled scores and standard scores are not the same. Scaled scores are specific to individual testing programs and use arbitrary scale ranges chosen by the test publisher. Standard scores are derived from statistical theory and express performance in terms of standard deviation units from a mean. While both are transformations of raw scores, they serve different purposes and are not interchangeable.
Conclusion
The reason you cannot compare scaled scores across different tests comes down to one core fact: each testing program builds its own independent measurement system. The SAT scale, the ACT scale, the GRE scale, and state test scales are separate statistical constructions with different ranges, different reference populations, and different equating processes. They are connected by no shared anchor items, no shared scale, and no shared statistical foundation.
If you need to compare performance across tests, use concordance tables for rough equivalency or compute z-scores if you have access to the necessary population statistics. But never assume that a number on one test scale means the same thing as a similar number on another. Understanding this distinction is the first step toward interpreting standardized test scores accurately and fairly, whether you are a student, a parent, an educator, or an admissions officer making high-stakes decisions.