
Imagine you read a headline claiming that people who carry lighters are more likely to develop lung cancer. Your first instinct might be to assume lighters cause cancer. But that conclusion misses something obvious: the people carrying lighters are smokers, and smoking is the real cause. This simple scenario captures the heart of why correlation does not imply causation, a principle that sits at the foundation of statistics, science, and clear thinking.
Every day, news outlets, social media posts, and even some research summaries present correlational findings as if they prove cause and effect. This leads to bad decisions, wasted money, and sometimes real harm. Understanding the difference between two variables moving together and one variable actually causing the other is one of the most practical analytical skills you can develop.
The phrase itself has become so common that it risks losing its meaning. People repeat it without understanding why it is true or when the warning actually applies. Our team has spent years working with data, and we have seen firsthand how easily a strong correlation can lead smart people to confidently wrong conclusions. The goal of this guide is to make sure that does not happen to you.
In this guide, we break down exactly what correlation and causation mean, walk through the five main reasons correlation does not imply causation, share real-world examples that make the concept stick, and show you how scientists actually go about establishing true cause-and-effect relationships. Whether you are a student, a data analyst, a journalist, or just someone who wants to think more clearly about the numbers you encounter, this article gives you the tools to tell the difference.
We will also address the history of the phrase, the Latin terminology behind it, and some common misconceptions that even trained researchers fall for. By the end, you will have a clear mental framework for evaluating any causal claim you encounter in the news, in research, or in everyday conversation.
Table of Contents
What Is Correlation?
Correlation is a statistical measure that describes how two variables move in relation to each other. When one variable changes, the other tends to change too, in a predictable pattern. The relationship is quantified by the correlation coefficient, a number that ranges from -1 to +1.
A positive correlation (closer to +1) means both variables increase together. For example, height and weight tend to show a positive correlation because taller people generally weigh more. A negative correlation (closer to -1) means one goes up while the other goes down. The relationship between exercise and resting heart rate is negative because more exercise tends to lower resting heart rate.
A correlation near zero means there is no clear linear relationship between the two variables. Knowing the value of one tells you essentially nothing about the value of the other. This is what statisticians call independence.
It is important to understand that correlation only measures linear relationships. Two variables can have a perfect nonlinear relationship and still show a correlation coefficient of zero. This is one reason correlation is a limited tool, and why it certainly cannot be used on its own to prove causation.
Here is the key point: correlation only describes an observed association. It tells you that two things tend to move together. It says nothing about why they move together or whether one is responsible for the other. That distinction matters more than most people realize, and failing to respect it is the source of countless errors in reasoning.
What Is Causation?
Causation means that a change in one variable directly produces a change in another. If variable A causes variable B, then manipulating A will reliably change B. There is a mechanism, a chain of events that connects the cause to the effect, and that mechanism can be explained and tested.
Establishing causation is far more demanding than spotting a correlation. You need to rule out alternative explanations, demonstrate a logical mechanism, and ideally show that changing the cause actually changes the effect. This is why scientists rely on controlled experiments rather than observational data when they want to make causal claims.
Causation also implies a specific temporal order. The cause must come before the effect. This sounds obvious, but it becomes surprisingly difficult to verify in real-world research where data is often collected at a single point in time rather than tracked over months or years.
Think of it this way. Correlation is noticing that roosters crow before sunrise. Causation is understanding that the sun does not rise because the rooster crows. The rooster’s behavior and the sunrise are correlated, but the rooster has nothing to do with why the sun comes up. The causal arrow points from the earth’s rotation to the sunrise, and the rooster merely responds to incoming light.
This example highlights a critical difference. Correlation can be observed passively. Causation must be demonstrated through intervention, mechanism, and elimination of alternatives. That is a much higher bar.
Why Correlation Does Not Imply Causation
The phrase “correlation does not imply causation” is not just a cautionary slogan. It reflects five specific statistical problems that can create misleading correlations. Each one trips up even experienced researchers when they are not careful, and understanding them is the first step to avoiding the trap.
1. Confounding Variables (The Third Factor)
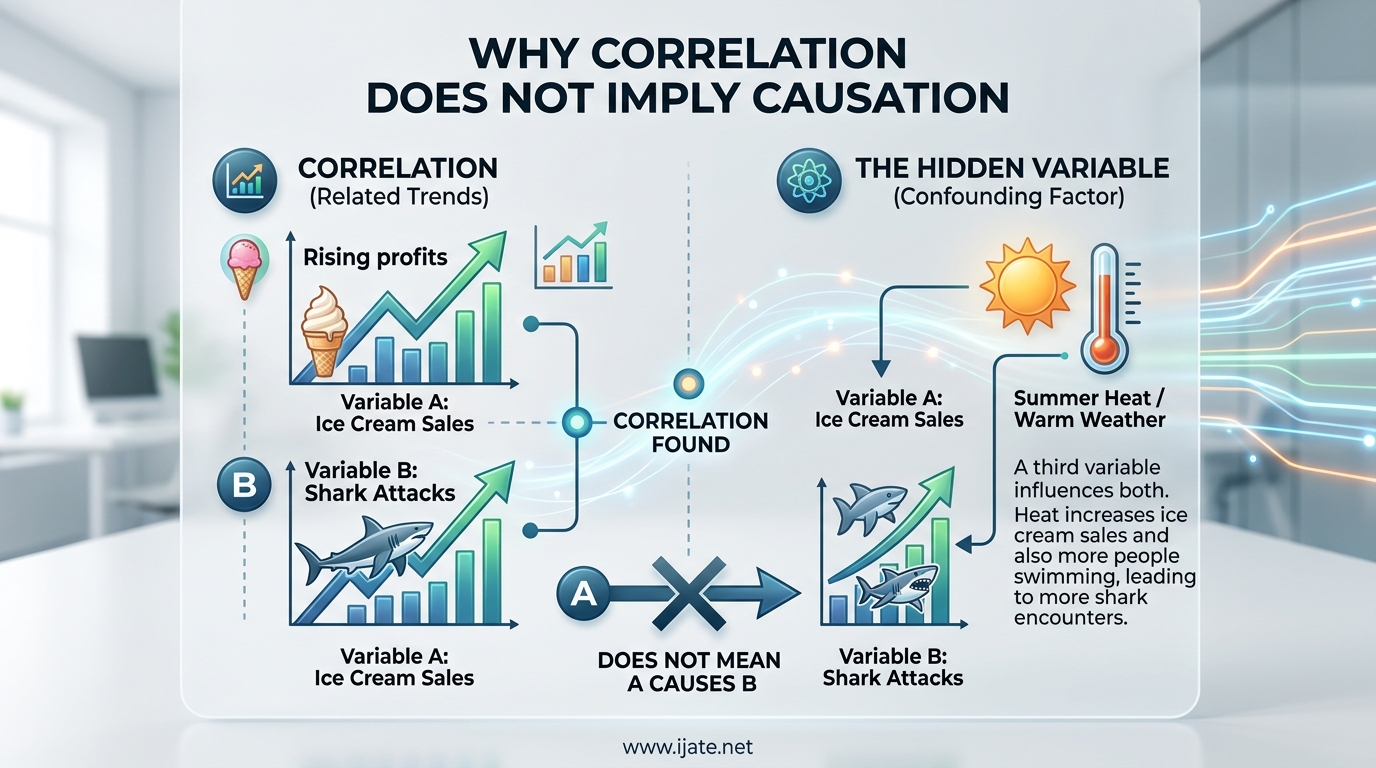
A confounding variable is a hidden third factor that influences both of the variables you are observing. Because it affects both, the two variables appear to be connected even though neither one actually causes the other. Confounders are sometimes called lurking variables or common-causal variables, and they are the most common source of misleading correlations.
The classic example is ice cream sales and drowning incidents. These two rise and fall together, with both peaking in the summer months. Someone looking only at the data might conclude that eating ice cream causes people to drown, or that drowning drives ice cream consumption. The confounding variable here is temperature. Hot weather drives people to buy more ice cream and also drives more people to swim, which unfortunately leads to more drownings.
Once you control for temperature, the apparent relationship between ice cream and drowning disappears entirely. This is the hallmark of a confounding variable: it creates a correlation that evaporates as soon as you account for it. The challenge in real research is that you may not know which confounders to look for, and some may be nearly impossible to measure.
Confounding variables are everywhere in observational data. They are the single biggest reason that correlational studies cannot, on their own, prove causation. Without identifying and controlling for all relevant confounders, any apparent causal link remains suspect. In fields like nutrition research, where dozens of lifestyle factors interact, confounders can make almost any finding unreliable without experimental confirmation.
2. Reverse Causality
Reverse causality happens when you have the direction of cause and effect backwards. Variable B might be causing variable A, but you assume A causes B because you see them moving together. The correlation is real, but your interpretation of which variable is driving the other is completely wrong.
Consider the observation that people who own expensive cars tend to have higher credit scores. It is tempting to say that buying a luxury car improves your credit. In reality, having strong finances and good credit makes it easier to afford an expensive car. The causation runs the opposite direction from what the surface correlation suggests.
Reverse causality is especially tricky in health research. Does stress cause illness, or does illness cause stress? Does exercise reduce depression, or do less depressed people exercise more? Does coffee cause anxiety, or do anxious people drink more coffee? Without experiments, it is genuinely hard to tell which variable is driving the other.
This problem is particularly acute in cross-sectional studies, where all variables are measured at the same time. With no temporal ordering in the data, you cannot determine which came first. Longitudinal studies, which track participants over time, can help, but even they cannot fully resolve reverse causality without experimental manipulation.
3. Spurious Correlation (Pure Coincidence)
Sometimes two variables move together for no meaningful reason at all. This is called a spurious correlation, and it is more common than you might think. With enough data and enough possible pairings, some combinations will line up purely by chance.
Statistician Tyler Vigen famously demonstrated this through his Spurious Correlations project, which showed that the number of films Nicolas Cage appeared in correlates remarkably well with the number of people who drowned in swimming pools over a ten-year period. Nobody believes Nicolas Cage movies cause pool drownings. The correlation exists purely by coincidence.
Another Vigen finding: per capita cheese consumption correlates with the number of people who died by becoming tangled in their bedsheets. The correlation coefficient is over 0.94, which would normally be considered a very strong relationship. But it is, of course, completely meaningless.
Spurious correlations become a real problem when people cherry-pick data to support a predetermined conclusion. If you sift through enough datasets, you can almost always find a correlation that fits your narrative, even when no meaningful relationship exists. This practice, sometimes called data dredging or p-hacking, is a serious problem in scientific publishing.
The mathematical reality is that with thousands of measurable variables in modern datasets, the probability of finding at least one pair with a strong correlation by pure chance approaches 100 percent. Without a theoretical reason to expect a relationship, even an apparently perfect correlation deserves deep skepticism.
4. Sample Selection Bias
The group you study can create correlations that do not represent reality. If your sample is not representative of the broader population, the relationships you observe may be artifacts of who you included rather than genuine patterns. This is known as sample selection bias, and it can distort findings in both directions.
Imagine a study that finds a strong correlation between attending an elite university and later career success. That finding might reflect real value from the education, but it also reflects selection bias. Elite universities admit students who are already high-achieving, motivated, and connected. Those same students would likely succeed regardless of where they studied.
Sample selection bias can also work the other way. Studying only people who survived a disease, for example, can make a treatment look more or less effective than it really is because you are missing the patients who did not survive. This is called survivorship bias, and it has led to some famously wrong conclusions in fields from medicine to finance.
The solution is careful study design, but that is easier said than done. Researchers must think hard about who is included in their sample, who is excluded, and whether those choices might create artificial correlations. In practice, this requires both statistical expertise and deep knowledge of the subject matter.
5. Measurement Error
When variables are measured imprecisely, the errors themselves can create or distort correlations. If you measure one variable with a flawed instrument, the noise introduced by that error can make it look connected to another variable when it is not. Conversely, measurement error can also mask real relationships, making them appear weaker than they truly are.
This is a recurring problem in survey-based research. People underreport socially undesirable behaviors, overreport desirable ones, and sometimes misunderstand the questions entirely. If you ask people about their alcohol consumption and their income, the measurement errors in both variables can combine to produce a correlation that exists only in the noise.
Measurement error is especially dangerous when the error itself is correlated with the variable you are studying. For example, if wealthy people are more likely to overreport their charitable giving, you might find an artificial correlation between income and generosity that disappears entirely with more accurate measurement.
In scientific instruments, measurement error is a constant concern. Even well-calibrated equipment introduces some noise, and when you combine data from multiple sources each with their own error patterns, the resulting correlations can be misleading in ways that are difficult to detect.
The Latin Roots: Cum Hoc Ergo Propter Hoc
The confusion between correlation and causation is ancient enough to have a Latin name. The fallacy is called cum hoc ergo propter hoc, which translates to “with this, therefore because of this.” It is a logical fallacy that has been recognized for thousands of years.
There is a closely related fallacy called post hoc ergo propter hoc, meaning “after this, therefore because of this.” This version assumes that because one event followed another, the first event caused the second. Both fallacies belong to a broader family called questionable cause fallacies, and they appear constantly in everyday reasoning.
Understanding the formal name for these errors is useful because it reminds us that the problem is not new. Philosophers and logicians have been warning against it since ancient Greece. The statistical version of the warning, “correlation does not imply causation,” is simply the modern, data-driven expression of a much older insight about human reasoning.
Real-World Examples of Misleading Correlations
The best way to internalize this concept is through concrete examples. Here are several that our team finds especially illustrative when explaining why correlation does not imply causation. Each one demonstrates a different way that correlational evidence can lead you astray.
Ice Cream Sales and Drowning
As mentioned earlier, ice cream sales and drowning deaths both spike during summer. The real driver is warm weather, which increases both the desire for cold treats and the number of people swimming. Remove the seasonal factor and the correlation between ice cream and drowning disappears entirely. This is the textbook example of a confounding variable.
Shoe Size and Reading Ability
In children, shoe size correlates strongly with reading ability. Children with bigger feet tend to read better. This sounds surprising until you realize that older children have both larger feet and better reading skills. Age is the confounding variable here, and once you control for it, the correlation vanishes. This example is popular in statistics classes because it makes the concept instantly clear.
Exercise and Skin Cancer
Some observational studies have found that people who exercise more have higher rates of skin cancer. Does exercise cause cancer? Unlikely. People who exercise tend to spend more time outdoors, often in the sun, which increases UV exposure and skin cancer risk. The sun exposure is the confounding variable, and controlling for it removes the apparent relationship.
Stork Population and Human Births
In several European countries, the number of storks correlates with the number of human births. This is a textbook spurious correlation that has been studied in peer-reviewed papers. Both variables are influenced by other factors, like rural population trends and economic development. More rural areas tend to have both more storks and more babies, but storks have absolutely nothing to do with delivering babies.
Education and Income
Higher education levels correlate strongly with higher income. While education does contribute to earning potential, the relationship is not as straightforward as it appears. People from wealthier families are more likely to attend college in the first place, and family background, networking, and innate ability all play roles. Saying education causes higher income without accounting for these factors oversimplifies the picture and can lead to misguided policy recommendations.
Coffee Consumption and Heart Disease
Early observational studies linked coffee consumption to heart disease, leading to decades of health warnings. Later research revealed that coffee drinkers were also more likely to smoke, exercise less, and have poorer diets overall. Once researchers controlled for these confounders, the link between coffee and heart disease largely disappeared. Some studies even suggest moderate coffee consumption may have protective effects.
Police Presence and Crime Rates
Neighborhoods with more police officers tend to have higher crime rates. Does more policing cause more crime? Almost certainly not. Cities deploy more officers to areas with higher crime, so the causation runs from crime to police presence, not the other way around. This is a classic example of reverse causality that continues to confuse public debate about policing strategies.
How to Establish Causation
If correlation cannot prove causation, how do researchers ever establish cause and effect? The answer lies in research design, specifically controlled experiments and established frameworks for evaluating causal evidence. There are several reliable paths from correlation to causation, each with its own strengths and limitations.
Randomized Controlled Experiments
The gold standard for establishing causation is the randomized controlled experiment. Participants are randomly assigned to either a treatment group or a control group. Because assignment is random, confounding variables should be distributed roughly equally across both groups. Any difference in outcomes can then be attributed to the treatment rather than to hidden third factors.
Randomization is what separates an experiment from an observational study. In observational research, you can only watch what happens. In an experiment, you actively manipulate one variable while holding everything else constant, which is the only way to definitively demonstrate causation.
This is why randomized controlled trials are required for drug approval. No matter how strong the observational correlation between a compound and improved health, regulators demand experimental proof before allowing causal claims. The same standard applies, in principle, to any field that wants to make causal statements.
The Bradford Hill Criteria
When experiments are not possible, as in many epidemiological studies, researchers turn to the Bradford Hill criteria. Developed by Sir Austin Bradford Hill in 1965, these nine criteria help evaluate whether an observed association is likely to be causal. The criteria do not provide mathematical certainty, but they offer a structured way to weigh evidence when randomization is impossible.
The criteria include strength of association, consistency across studies, specificity, temporality (the cause must come before the effect), biological gradient (dose-response relationship), plausibility, coherence with existing knowledge, experimental evidence, and analogy. No single criterion is definitive, but the more criteria that are met, the stronger the case for causation.
These criteria were famously used to establish that smoking causes lung cancer, even though no randomized experiment could ethically assign people to smoke. The evidence met nearly all nine criteria, making the causal conclusion overwhelming despite the absence of experimental data. This remains the most celebrated application of the framework.
Questions to Ask When Evaluating Causal Claims
When you encounter a correlational finding presented as causal, ask yourself a series of diagnostic questions. Is there a plausible mechanism connecting the two variables? Could a third variable explain both? Could the causation run in the opposite direction? Has the finding been replicated in different populations and settings? Was the study experimental or observational?
Also consider the strength of the correlation. A very strong correlation is more suggestive of a causal link than a weak one, though it can still be spurious. Think about the sample size and whether it was large enough to detect a real effect. Check whether the researchers controlled for obvious confounders.
If the answers are unsatisfying, treat the causal claim with skepticism. Correlation is a useful starting point for investigation, but it is never the final word on causation. The best researchers treat every correlational finding as a hypothesis to be tested, not a conclusion to be published.
Common Misconceptions About Correlation and Causation
One misconception our team encounters frequently is that correlation is meaningless. This is wrong. Correlation is often the first clue that a causal relationship might exist. It tells researchers where to look and what to test next. Dismissing all correlational evidence is just as unscientific as treating every correlation as proof of causation. Many of the most important discoveries in medicine and social science began with a correlational observation that was later confirmed experimentally.
Another misconception is that causation always implies correlation. In most cases it does, but there are exceptions. A causal relationship can be nonlinear, masked by confounding variables, or cancelled out by opposing effects. So while causation often produces correlation, the absence of an obvious correlation does not always rule out causation.
A third misconception is that only weak correlations are misleading. In fact, very strong correlations are often spurious, as the Nicolas Cage and bedsheets examples demonstrate. The strength of a correlation tells you nothing about whether it reflects a real causal link. Only research design can settle that question.
Finally, some people believe that large sample sizes solve the problem. They do not. A massive observational study can produce a statistically significant correlation that is entirely spurious. Statistical significance means the correlation is unlikely to be due to random sampling error, but it says nothing about confounders, reverse causality, or coincidence. A large sample makes you more confident that the correlation exists, not that it reflects causation.
Why Correlation Does Not Imply Causation: Frequently Asked Questions
What are the reasons why a correlation cannot determine causation?
Correlation cannot determine causation because of confounding variables, reverse causality, spurious correlation, sample selection bias, and measurement error. Any of these factors can create an apparent relationship between two variables without a true cause-and-effect link.
Why do psychologists warn that you cannot infer causation from correlation?
Psychologists warn against inferring causation from correlation because most psychological research relies on observational data where confounding variables and reverse causality are difficult to rule out. Without controlled experiments, you cannot determine which variable is actually driving the observed effect.
Is it true that correlation proves causation?
No, correlation does not prove causation. Two variables can move together due to coincidence, a hidden third factor, or reversed cause and effect. Only controlled experiments that manipulate one variable while holding others constant can establish true causation.
Can causation exist without correlation?
Yes, causation can exist without a visible correlation in some cases. A causal relationship may be nonlinear, hidden by confounding variables, or cancelled out by opposing effects. So while causation usually produces correlation, the absence of correlation does not always prove the absence of causation.
Conclusion
Understanding why correlation does not imply causation protects you from drawing faulty conclusions from data. Correlation is a starting point, a clue that two variables are connected in some way. But proving that one causes the other requires ruling out confounding variables, reverse causality, coincidence, and bias through careful experimental design.
The next time you see a headline claiming one thing causes another based on a correlational study, ask the questions we outlined above. Look for controlled experiments, check whether confounders were addressed, and remember that even strong correlations can be completely misleading. Clear thinking about correlation and causation is a skill worth developing, and it starts with healthy skepticism toward easy answers.