
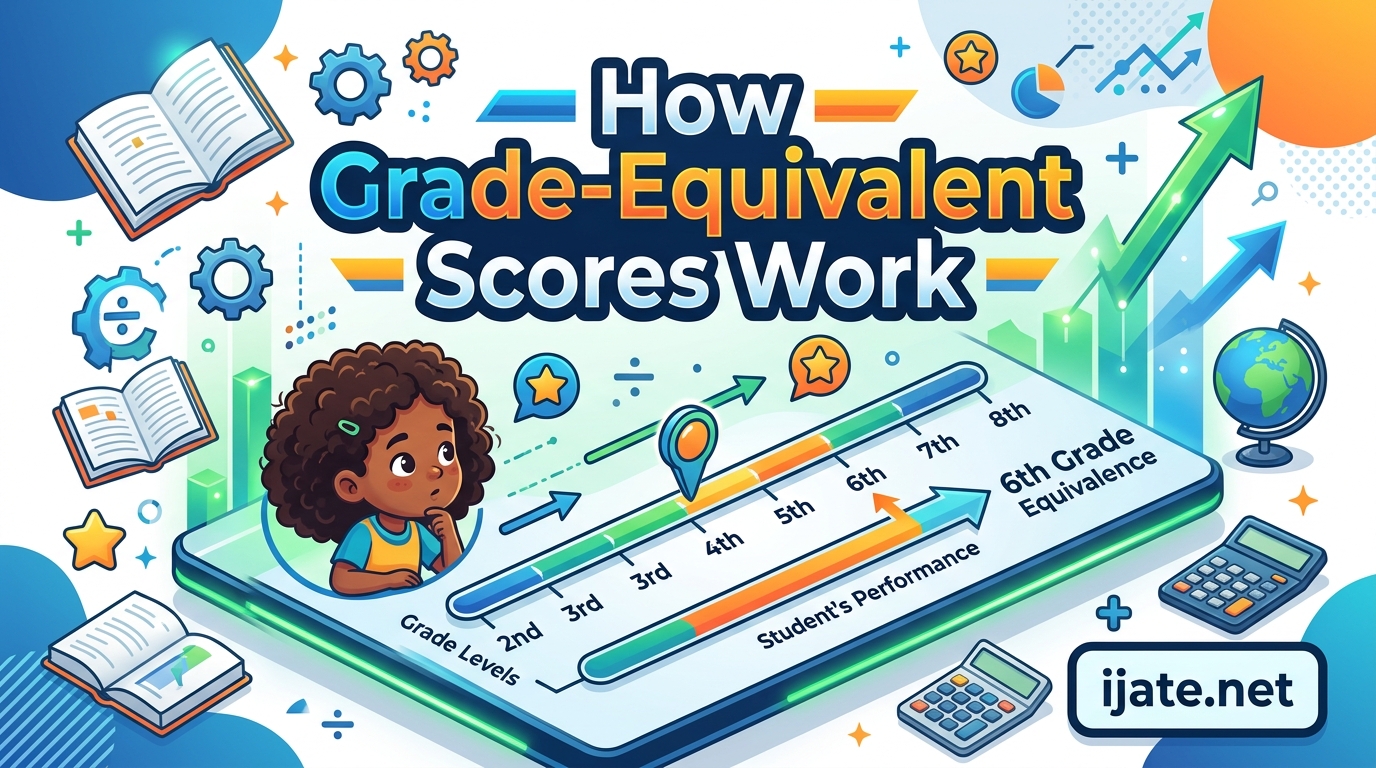
You open your child’s standardized test report and see a score that reads “GE: 8.2.” Your child is in fifth grade. Panic sets in, or maybe excitement, depending on whether you assume that number means your child is behind or three years ahead. Either way, you are probably drawing the wrong conclusion. Grade-equivalent scores are one of the most widely misunderstood metrics in educational assessment, and nearly every test manual explicitly warns against over-interpreting them.
In this guide, I will walk you through exactly how grade-equivalent scores are calculated, why they consistently mislead parents, and what you should actually focus on when reading a score report. Whether you are a parent trying to decode assessment results or an educator who needs to explain them at a conference night, this breakdown will give you the clarity you need.
Table of Contents
What Are Grade-Equivalent Scores?
A grade-equivalent score is a norm-referenced metric that compares a student’s performance to the median raw score of students at different grade levels in the test’s norm group. The score is written as a decimal: the whole number represents the grade level, and the decimal represents the month of that grade. So a grade-equivalent of 6.5 means the student performed like an average student in the fifth month of sixth grade would perform on that same test.
Here is the critical detail that almost everyone misses: a grade-equivalent score does not mean the student is doing work at that grade level. A fourth grader who earns a grade-equivalent of 8.0 on a fourth-grade reading test did not somehow master eighth-grade reading skills. It means that if an average eighth grader sat down and took that fourth-grade test, they would likely earn the same raw score. The test itself never changes. The comparison is always to the same set of grade-level-appropriate questions.
That distinction, between grade-level mastery and comparative performance, is where most misinterpretation begins. The score tells you how a student ranks relative to a norm group, not what skills the student has actually acquired.
How Grade-Equivalent Scores Are Calculated
Understanding the calculation process makes it much easier to see why these scores produce confusion. The process is more mechanical than most people realize, and it relies entirely on median raw scores from a norm-referenced test administered to a carefully selected sample of students across many grade levels.
Step 1: Administer the test to a norm group. The test publisher gives the same assessment instrument to a large, nationally representative sample of students at each grade level. For a test like the Woodcock-Johnson or the Iowa Assessments, this norm group might include tens of thousands of students across all 50 states, carefully weighted to match national demographics.
Step 2: Calculate the median raw score at each grade level. For each grade, the publisher finds the median raw score, which is the middle value when all student scores are arranged from lowest to highest. This median becomes the benchmark for that grade and month. For example, the median raw score for fourth graders in their eighth month of school might be 42 out of 60 correct answers.
Step 3: Match the student’s raw score to the grade-level median. When your child takes the test, their raw score is compared against the table of grade-level medians. If your fourth grader answered 51 questions correctly, the publisher looks at the median table and finds that 51 correct answers matches the median for sixth graders in their second month. Your child receives a grade-equivalent score of 6.2.
Step 4: Interpolate or extrapolate as needed. Raw scores rarely match a median exactly. Publishers use statistical interpolation to estimate the grade-equivalent for scores that fall between two medians. For scores above the highest grade-level median, they extrapolate. This extrapolation is where some of the most misleading scores are born, because it produces grade-equivalents of 12.0, 14.0, or even higher for advanced students who simply did very well on a grade-level test.
Here is a concrete example. Imagine a vocabulary subtest where the median raw scores look like this: fourth graders score a median of 38, fifth graders score 44, and sixth graders score 49. A fourth grader who scores 49 receives a grade-equivalent of 6.0. That does not mean this child reads at a sixth-grade level. It means this child got as many vocabulary questions right as the average sixth grader would get on the same set of fourth-grade vocabulary items. The questions never became harder. The child simply outperformed expectations for their own grade.
Why Grade-Equivalent Scores Mislead Parents
Research from Eastern Illinois University found that 76.7% of parents and 65.6% of teachers misinterpret grade-equivalent scores. That is an astonishing failure rate for a metric still printed on millions of score reports every year. The problem is not that parents are uneducated. The problem is that the label itself invites a completely wrong interpretation.
The Score Does Not Measure Grade-Level Mastery
This is the single biggest source of confusion. When a parent sees “GE 8.2” on a third grader’s report, the natural assumption is that the child is doing eighth-grade work. School psychologists on Reddit’s r/schoolpsychology forum describe this reaction constantly. Parents either panic that their child is years behind, or they assume their child is a prodigy who should skip several grades. Neither conclusion follows from the score, because the score says nothing about what skills the child has or has not mastered at any grade level. It only describes how the child’s raw score compares to medians from other grades on the same test.
Ceiling Effects Create Impossible Scores
Many grade-level tests have a ceiling, meaning the questions top out at a certain difficulty. A very bright fourth grader might answer every question correctly, hitting the ceiling. The publisher then extrapolates beyond the available data to assign a grade-equivalent. This is how you see scores like 13.0 or even 18.0 on an elementary school report. Parents naturally read that as post-graduate performance, which is obviously absurd. The child is not doing college-level math. The child simply maxed out a fourth-grade math test, and the statistical extrapolation produced a number that has no real-world meaning at that level.
The Intervals Between Scores Are Not Equal
Standard scores and percentile ranks have equal intervals. A five-point difference means the same thing whether you are moving from 85 to 90 or from 115 to 120. Grade-equivalent scores do not share this property. A difference of one grade-equivalent point at the elementary level might represent a much smaller difference in actual skill than the same one-point difference at the middle school level. This makes grade-equivalent scores mathematically invalid for averaging, tracking growth over time, or comparing performance across subject areas. Yet many schools and even some IEP teams still average them.
Variable Performance Is Not Factored In
A single test on a single day produces the grade-equivalent score. As one school psychologist on Reddit put it, grade-equivalent scores “don’t factor in that maybe Jimmy had a variable performance.” A child who slept poorly, felt anxious, or simply had an off day might score significantly below their actual ability. The grade-equivalent label then makes that bad day look like a multi-year deficit, which is terrifying to parents who do not understand the score’s limitations.
Parents Focus Exclusively on Grade-Equivalents
BCBA practitioners report that parents often only want to look at age-equivalency or grade-equivalency scores, ignoring the more reliable standard scores and percentile ranks that appear on the same report. The grade-equivalent is the easiest number to grasp, so it dominates the conversation. This means the least reliable metric on the page gets the most attention, which is exactly backwards from what assessment professionals recommend.
Grade-Equivalent vs Percentile Rank vs Standard Scores
If grade-equivalent scores are so problematic, what should you look at instead? Most assessment professionals recommend focusing on standard scores and percentile ranks, both of which have stronger statistical properties and communicate performance more accurately.
Standard scores are based on a normalized scale, typically with a mean of 100 and a standard deviation of 15. They have equal intervals, which means a five-point gain represents the same amount of growth whether you are moving from 85 to 90 or from 110 to 115. Standard scores allow for meaningful comparison across subtests, across test administrations, and across different testing instruments. If you want to track your child’s growth over several years, standard scores are the metric to use.
Percentile ranks tell you what percentage of the norm group scored at or below your child’s score. A percentile rank of 75 means your child scored equal to or better than 75% of students in their grade in the norm group. Percentile ranks are intuitive, easy to explain to parents, and they communicate relative standing clearly without implying anything about grade-level content mastery that does not exist.
Grade-equivalent scores should be treated as a rough approximation at best. Test manuals from major publishers like Pearson and Riverside Insights explicitly warn against using them for placement decisions, IEP documentation, or any high-stakes educational choice. If your school continues to lead with grade-equivalents on reports, ask for the standard scores and percentile ranks that almost always accompany them.
How to Talk to Parents About Grade-Equivalent Scores
If you are an educator or school psychologist, you have probably sat through more than one conference where a parent fixated on a grade-equivalent score and ignored everything else. The key is reframing the conversation before the number takes over. Here are the strategies that experienced professionals recommend.
1. Lead with percentile ranks, not grade-equivalents. Start the conversation with where the child stands relative to peers. A percentile rank is immediately understandable and does not invite the false assumption that the child is working at a different grade level.
2. Explain the score with a concrete analogy. One popular analogy from the r/schoolpsychology community: if a fourth grader runs a mile in the same time as an average sixth grader, that does not mean the fourth grader is running on a sixth-grade track team. It means they ran fast for their age. The comparison is about relative performance, not about the difficulty of the track.
3. Avoid the phrase “grade-level performance” entirely. This phrase reinforces the exact misconception that grade-equivalent scores create. Instead, talk about how the student performed relative to expectations for their grade and age.
4. Acknowledge what the score cannot tell you. Be upfront about limitations. Tell parents that the score does not reflect mastery of specific skills, does not account for a single day’s performance, and cannot be used to determine whether a child needs to skip or repeat a grade.
5. Provide actionable next steps. Parents trust numbers, but they act on guidance. Tell them what the score suggests about areas to support, what interventions or enrichment might help, and what the follow-up assessment plan looks like.
FAQ’s
Why are grade equivalent scores misleading?
Grade-equivalent scores are misleading because they appear to measure grade-level mastery but actually only compare a student’s raw score to median scores from other grade levels on the same test. A score of GE 8.2 does not mean the student is doing eighth-grade work. It means the student answered as many questions correctly as the average eighth grader would on the same grade-level test. Research shows 76.7% of parents misinterpret these scores.
How are grade equivalent scores calculated?
Grade-equivalent scores are calculated by administering the same test to a nationally representative norm group across multiple grade levels, finding the median raw score at each grade and month, then matching an individual student’s raw score to the closest grade-level median. If a fourth grader’s raw score matches the median for sixth graders in month two, the student receives a grade-equivalent of 6.2. Scores that fall between medians are interpolated, and scores above the highest grade median are extrapolated.
How do you interpret grade equivalency scores?
Interpret grade-equivalent scores as a rough comparison to the norm group, not as a measure of grade-level mastery. A high grade-equivalent means the student performed well relative to grade-level expectations. A low grade-equivalent means the student performed below expectations. Always pair the grade-equivalent with the standard score and percentile rank for an accurate picture, and never use it alone for placement or intervention decisions.
How to explain grade equivalent scores to parents?
Lead with percentile ranks instead of grade-equivalents. Use a concrete analogy, such as comparing the score to running speed rather than track difficulty. Avoid the phrase grade-level performance. Acknowledge what the score cannot tell you, including mastery of specific skills and the impact of a single day’s performance. Provide clear next steps so parents know what to do with the information.
What does a grade equivalent score of 8.2 mean?
A grade-equivalent score of 8.2 means the student’s raw score matched the median raw score of students in the second month of eighth grade in the norm group. It does not mean the student is performing eighth-grade work or has mastered eighth-grade skills. It means the student answered the same number of questions correctly as the average eighth grader would on that same test.
Are grade equivalent scores used for IEP documentation?
Test manuals from major publishers explicitly warn against using grade-equivalent scores for IEP documentation, placement decisions, or any high-stakes educational choices. Standard scores and percentile ranks are the recommended metrics for IEP goals and progress monitoring because they have equal intervals, stronger reliability, and can be used to track growth over time. Some schools still include grade-equivalents on IEP reports, but they should never be the primary metric driving decisions.
What Parents Should Focus On Instead
Grade-equivalent scores are not going to disappear from score reports anytime soon, despite the warnings from every major test publisher. That means the responsibility falls on parents and educators to read them correctly and not let a single decimal point drive major decisions about a child’s education. The most reliable information on any standardized test report lives in the standard scores, the percentile ranks, and the confidence intervals, not in the grade-equivalent column.
If you take away one thing from this guide, let it be this: a grade-equivalent score tells you how your child compared to a norm group on a single day. It does not tell you what your child knows, what your child is ready to learn, or whether your child is working above or below grade level. For that information, look at the standard score, ask your child’s teacher about classroom performance, and use multiple data points rather than a single test result.
Understanding how grade-equivalent scores are calculated and why they mislead parents gives you an immediate advantage the next time you sit down at a parent-teacher conference. You will know what questions to ask, which numbers to trust, and how to translate a confusing score report into real support for your child’s learning.