
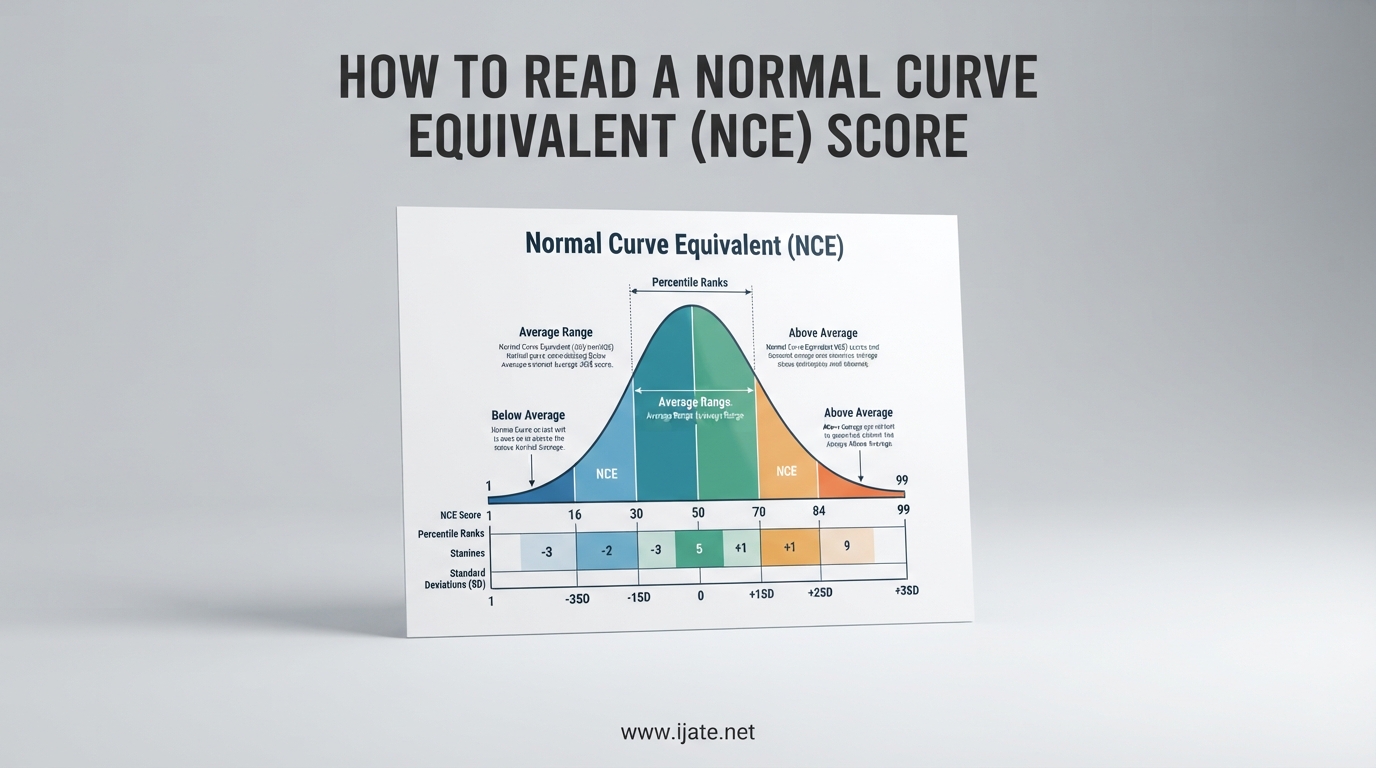
If you have ever stared at a standardized test report and seen a number labeled “NCE” next to a percentile rank, you are not alone in feeling confused. Teachers, parents, and even administrators routinely mix up these two scores, which leads to misreading student progress. Knowing how to interpret a normal curve equivalent score is essential for making fair, mathematically sound decisions about student achievement and program effectiveness.
I have spent years working with educational assessment data, and the single most common mistake I see is treating an NCE score as if it were a percentile. They look similar on paper, but they behave very differently when you try to average them or measure growth over time. Once you understand the underlying logic, reading these scores becomes straightforward.
In this guide, you will learn what an NCE score is, how the scale works, the exact formula used to calculate it, and a step-by-step process for interpreting any score you encounter. I will also walk through concrete examples, provide an NCE-to-percentile conversion table, and clear up the most common misconceptions that trip people up.
Table of Contents
Quick Answer: What Is a Normal Curve Equivalent Score?
A Normal Curve Equivalent (NCE) score is a normalized standard score with a mean of 50 and a standard deviation of 21.06, ranging from 1 to 99. It is calculated using the formula NCE = 50 + 21.06 x z-score, which preserves equal-interval properties unlike a percentile rank. Three anchor points hold true: NCE 1 equals the 1st percentile, NCE 50 equals the 50th percentile, and NCE 99 equals the 99th percentile.
What Is a Normal Curve Equivalent (NCE) Score?
A Normal Curve Equivalent score is a way of converting raw test results onto a standardized 1-to-99 scale that mirrors the shape of a normal distribution (the classic bell curve). It was developed in 1976 by the RMC Research Corporation for the United States Department of Education, specifically to support Title I program evaluation. The federal government needed a score type that could be legally averaged across students, classrooms, and schools to measure program effectiveness.
Here is why that matters. Percentile ranks are ordinal, meaning the distance between the 50th and 60th percentile is not the same as the distance between the 80th and 90th percentile. That makes percentile ranks mathematically improper for averaging. NCE scores solve this problem by stretching percentile information onto an equal-interval scale, where every one-point jump represents the same underlying distance from the mean.
In practical terms, NCE scores show up on reports from major assessment systems including Renaissance Star Reading and Star Math, Imagine Math, and many state-level standardized tests. If you work in K-12 education, special education, or federal program accountability, you will encounter NCE scores regularly. Parents who receive Renaissance Star score reports will also see NCE values printed alongside percentile ranks, often without any explanation of what the number means.
NCE Score Scale and Properties
The NCE scale has four defining properties that make it distinct from other score types. Understanding these properties is the foundation for accurate interpretation.
Mean of 50. The center of the NCE scale is 50, which represents the exact average performance for the norming group. A student scoring 50 performed at the median level.
Standard deviation of 21.06. Each standard deviation on the NCE scale equals 21.06 points. That specific number was chosen so that NCE 1 lines up with the 1st percentile and NCE 99 lines up with the 99th percentile. Some sources round this to 21 for simplicity, which is fine for rough estimates.
Range of 1 to 99. NCE scores never reach 0 or 100. The scale is bounded so that the extremes correspond exactly to the 1st and 99th percentiles.
Equal-interval property. This is the key feature. A 10-point difference means the same thing anywhere on the scale. The gap between NCE 30 and 40 is identical in magnitude to the gap between 60 and 70. This is what allows educators to average NCE scores across groups without violating statistical rules.
One related question that comes up in general statistics is “What is a 1.96 normal curve?” That number refers to the z-score that marks the 97.5th percentile in a standard normal distribution, meaning roughly 97.5% of all values fall below it. It is commonly used for 95% confidence intervals but is not directly part of the NCE scale itself.
How to Calculate a Normal Curve Equivalent: The NCE Formula
The NCE formula is straightforward once you break it into steps. Here is the core equation:
NCE = 50 + (21.06 x z)
Where z is the z-score corresponding to the student’s percentile rank on a standard normal distribution. Here is how to calculate a normal curve equivalent step by step.
Step 1: Find the percentile rank. Start with the student’s percentile rank from the norm-referenced test. For example, say a student scored at the 84th percentile.
Step 2: Convert the percentile to a z-score. Use a z-table or a function like NORMSINV in Excel. The 84th percentile corresponds to a z-score of approximately 1.0.
Step 3: Multiply the z-score by 21.06. In this example, 1.0 x 21.06 = 21.06.
Step 4: Add 50. The final NCE is 50 + 21.06 = 71.06, which rounds to 71.
So a student at the 84th percentile has an NCE of about 71. Notice how the percentile (84) and the NCE (71) differ, even though they describe the exact same performance level. This difference is exactly why the two scores cannot be used interchangeably.
You can also reverse the process. To convert an NCE back to a percentile, first subtract 50 from the NCE, divide by 21.06 to get the z-score, then look up that z-score in a standard normal table. In Excel, use =NORMSDIST((NCE-50)/21.06) to get the percentile directly.
How to Read and Interpret NCE Scores
Learning how to interpret a normal curve equivalent score comes down to asking three questions: Is the student above or below average? How far from the mean are they? Is that difference meaningful? Here is a practical step-by-step process.
Step 1: Compare to 50. The mean is 50. Any score above 50 indicates above-average performance relative to the norming group. Any score below 50 indicates below-average performance. A score of exactly 50 means the student performed right at the median.
Step 2: Measure the distance in standard deviations. Divide the difference between the NCE and 50 by 21.06. An NCE of 71 gives you (71-50)/21.06 = about 1.0 standard deviation above the mean. An NCE of 29 is about 1.0 standard deviation below. This tells you the magnitude of the difference.
Step 3: Translate to plain language. Use these general benchmarks for interpretation. An NCE of 65 or higher is well above average. Scores between 55 and 64 are moderately above average. Scores from 45 to 55 are average. Scores from 36 to 44 are moderately below average. Anything below 35 is significantly below average.
Step 4: Compare across time or tests. Because NCE scores are equal-interval, you can subtract one from another to measure growth. If a student scores an NCE of 42 in the fall and 55 in the spring, that is a 13-point gain. That gain represents real movement because the scale is consistent across those points.
Let me walk through three concrete examples. An NCE of 70 means the student scored about 20 points above the mean, roughly 0.95 standard deviations up, which corresponds to the 83rd percentile. An NCE of 35 means the student is 15 points below the mean, about 0.71 standard deviations down, landing near the 24th percentile. An NCE of 50 means the student is exactly average, at the 50th percentile.
A common question from parents is whether an NCE score of 65 is good for a third grader. The answer is yes, it indicates above-average performance roughly one-third of a standard deviation above the mean, which corresponds to about the 63rd percentile. The grade level matters only in that the norming group is grade-specific, but the interpretation of the number itself stays the same.
NCE to Percentile Conversion Table
Use this conversion table as a quick reference for common NCE values. Remember that NCE 1, 50, and 99 are the only points that match percentile ranks exactly. Every other NCE maps to a different percentile number.
| NCE Score | Approximate Percentile | Interpretation |
|---|---|---|
| 99 | 99th | Extremely high |
| 90 | 97th | Well above average |
| 80 | 92nd | Above average |
| 71 | 84th | Above average (1 SD above mean) |
| 65 | 76th | Moderately above average |
| 60 | 68th | Slightly above average |
| 50 | 50th | Average (the mean) |
| 40 | 32nd | Slightly below average |
| 35 | 24th | Moderately below average |
| 29 | 16th | Below average (1 SD below mean) |
| 20 | 8th | Well below average |
| 10 | 3rd | Significantly below average |
| 1 | 1st | Extremely low |
Notice the pattern. Near the middle of the scale, NCE and percentile values are relatively close. But at the extremes they diverge sharply. An NCE of 90 maps to the 97th percentile, not the 90th. This is the single biggest source of confusion on test reports.
NCE Score vs. Percentile Rank: Key Differences
The distinction between NCE scores and percentile ranks causes more confusion than any other topic in educational assessment. Here is a side-by-side breakdown.
| Property | NCE Score | Percentile Rank |
|---|---|---|
| Scale type | Equal-interval | Ordinal |
| Range | 1 to 99 | 1 to 99 |
| Mean | 50 | 50 |
| Standard deviation | 21.06 | Variable (not constant) |
| Can be averaged? | Yes | No (statistically invalid) |
| Distribution shape | Normal (bell-shaped) | Flat (rectangular) |
| Best used for | Growth, group averages, program comparison | Individual rank within a group |
The most important practical difference is averaging. If you have three students with percentile ranks of 40, 50, and 60, you cannot simply average those to 50 and call it meaningful. The middle percentile represents a larger chunk of students than the extremes. But with NCE scores of 40, 50, and 60, the average of 50 is mathematically valid because every point on the scale is equidistant.
This is exactly why the federal government adopted NCE scores for Title I evaluation. Program effectiveness requires comparing group averages across time periods. You cannot do that with percentiles. You can with NCE scores.
Another common question from forum discussions: why does a child’s percentile rank drop while their NCE stays the same? This happens when the student’s actual performance held steady but the norming group shifted, or when the student improved slightly but not enough to maintain their relative standing among peers. The NCE is more stable for tracking real growth because it reflects absolute distance from the mean rather than relative ranking.
Common Misconceptions About NCE Scores
After working with assessment data across multiple school districts, I see the same misunderstandings repeat themselves. Let me address the most common ones directly.
Misconception 1: “An NCE of 80 means the student scored better than 80% of peers.” This is false. An NCE of 80 corresponds to roughly the 92nd percentile, not the 80th. The NCE number and percentile number only match at 1, 50, and 99.
Misconception 2: “You can average percentile ranks the same way you average NCE scores.” You cannot. Percentile ranks are ordinal data. Averaging them produces statistically meaningless results. Always average NCE scores instead.
Misconception 3: “A higher NCE always means the student improved.” Not necessarily. If a student scores NCE 55 in the fall and NCE 50 in the spring, their relative standing dropped, but their actual skill level may have grown if the norming group also changed. Always look at scale scores or grade equivalents alongside NCE for the full picture.
Misconception 4: “NCE scores and stanines are interchangeable.” They are not. Stanines group scores into nine broad bands, losing precision. NCE scores provide 99 distinct levels. A stanine of 7 covers NCE scores from roughly 63 to 78, a wide range that masks meaningful differences.
Misconception 5: “NCE scores only matter for Title I reporting.” While NCE scores originated for Title I, they are now used in Renaissance Star assessments, Imagine Math, and many other platforms for everyday instructional decisions. Understanding them helps far beyond federal compliance.
NCE Scores for Parents and Guardians
If you are a parent reading a test report and trying to understand what the NCE number means for your child, here is a plain-language guide.
Think of the NCE score as a ruler where 50 is the middle. Every point above 50 means your child performed a little better than average. Every point below 50 means they performed a little below average. The further the number is from 50 in either direction, the more noticeable the difference from typical performance.
A score between 45 and 55 means your child is performing right in line with grade-level expectations. Scores above 60 suggest your child is ahead of most peers. Scores below 35 may signal that additional support could help.
The biggest thing to remember is this: the NCE number is not the same as the percentile number, even though they look similar. If your child has an NCE of 75, that does not mean they beat 75% of students. It actually corresponds to about the 88th percentile, which is better than it sounds.
When you look at growth over time, focus on whether the NCE went up or down rather than the percentile rank. A student whose NCE goes from 45 to 52 has shown real growth, even if their percentile rank barely moved. That upward NCE trend is the stronger indicator of learning progress.
How NCE Scores Are Used in Schools
Schools and districts use NCE scores for three main purposes: measuring individual student growth, evaluating program effectiveness, and comparing aggregate performance across schools or demographic groups.
For individual growth, educators calculate what is called a gain score. If a student starts the year at NCE 40 and ends at NCE 52, the gain score is 12 points. Because the scale is equal-interval, that 12-point gain means the same thing regardless of where the student started.
For program evaluation, schools average the NCE scores of all participating students before and after an intervention. A program that moves the average NCE from 48 to 53 is producing measurable results. This is exactly the methodology the federal government requires for Title I accountability reporting.
One caution worth noting from the research literature: NCE scores should not be used to compute effect sizes by simply dividing the mean difference by a standard deviation, because the NCE standard deviation of 21.06 is built into the scale already. This is a subtle point that even experienced researchers sometimes get wrong.
Frequently Asked Questions
What is the normal curve equivalent score?
A normal curve equivalent (NCE) score is a normalized standard score on a scale from 1 to 99, with a mean of 50 and a standard deviation of 21.06. It converts percentile information onto an equal-interval scale so scores can be legally averaged across students, tests, and time periods for measuring academic growth and program effectiveness.
How do you interpret a normal curve?
To interpret a normal curve equivalent score, compare it to the mean of 50. Scores above 50 are above average, scores below 50 are below average, and a score of 50 is exactly average. Divide the difference between the NCE and 50 by 21.06 to find how many standard deviations the student is from the mean. For example, an NCE of 71 is about one standard deviation above average, corresponding to roughly the 84th percentile.
What is a 1.96 normal curve?
A value of 1.96 on a standard normal curve represents the z-score at the 97.5th percentile, meaning 97.5% of all values fall below it. It is widely used in statistics for 95% confidence intervals. It is not part of the NCE scale directly, but on the NCE scale it would equal approximately 50 + (21.06 x 1.96) = about 91.
How to calculate normal curve equivalent?
To calculate an NCE score, first convert the student’s percentile rank to a z-score using a z-table or Excel function NORMSINV. Then apply the formula NCE = 50 + (21.06 x z-score). For example, a student at the 84th percentile has a z-score of 1.0, so their NCE is 50 + 21.06 = approximately 71.
Conclusion
Understanding how to interpret a normal curve equivalent score gives you a powerful tool for reading standardized test results accurately. The key takeaways are simple: the mean is 50, each 21.06 points equals one standard deviation, and the only points where NCE matches percentile are 1, 50, and 99. Use NCE scores when you need to average results or measure growth over time, and rely on percentile ranks when you simply want to know where a student stands relative to peers. Next time you receive a test report, look past the percentile number and check the NCE to get the full picture of student performance.