
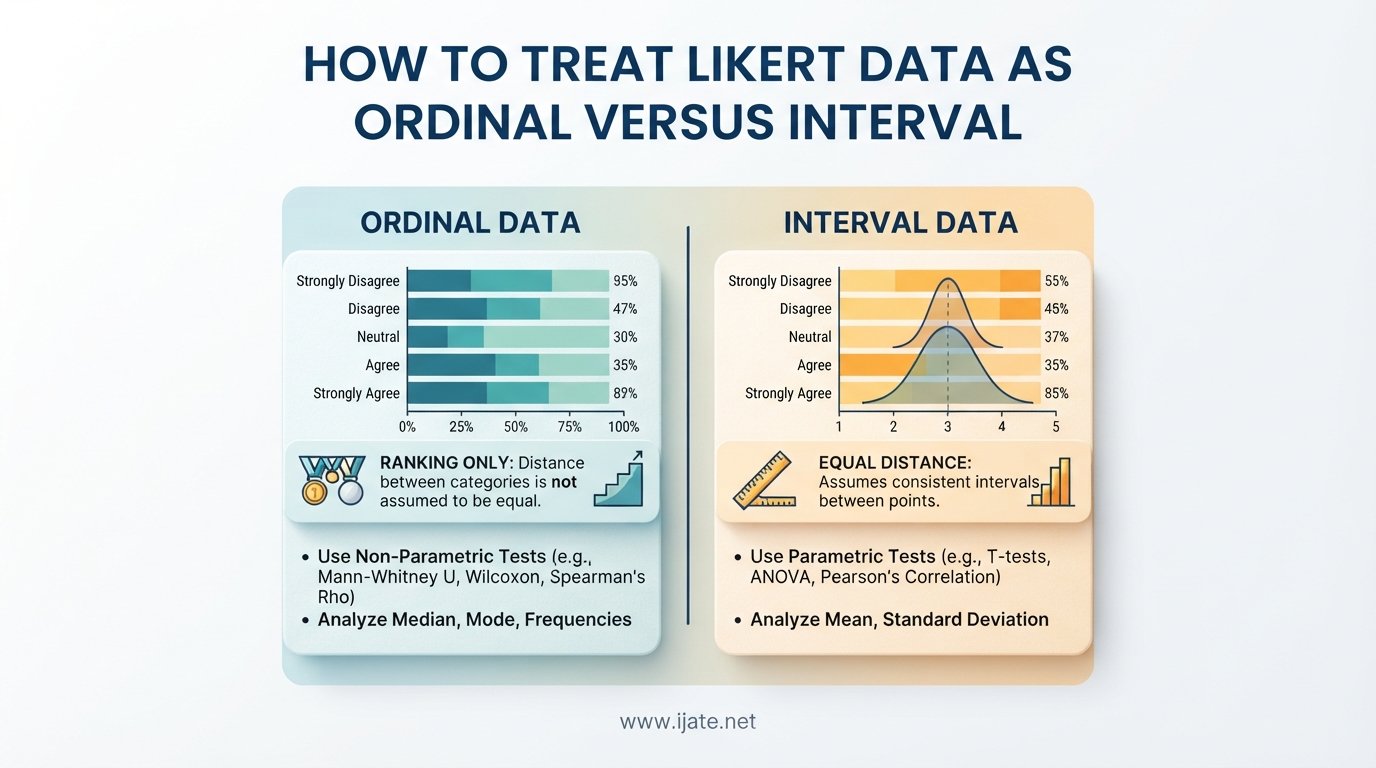
Every researcher who has ever designed a survey has run into the same question: should you treat Likert data as ordinal versus interval? It is one of the most debated topics in social science statistics, psychology, marketing research, and any field that relies on attitude measurement. Dissertation advisors give conflicting advice, textbooks sometimes disagree, and forum threads on Reddit and Stack Exchange can stretch to hundreds of comments without a clean resolution.
The good news is that the answer does not have to be a binary choice. You can make a principled, defensible decision based on your research context, sample size, number of scale points, and whether you are analyzing individual items or composite scores. In this guide, I will walk you through everything you need to know about how to treat Likert data as ordinal versus interval so you can choose the right statistical approach with confidence.
We will cover the definitions of ordinal and interval data, the theoretical roots of the debate in Stevens’ 1946 classification system, the specific conditions under which each treatment is appropriate, a practical decision framework, software implementation examples in R and Python, and common mistakes to avoid. Whether you are a graduate student running your first survey analysis or an experienced researcher looking for a clear reference, this guide will give you the tools to make the right call.
Table of Contents
What Is a Likert Scale?
A Likert scale is a type of rating scale developed by psychologist Rensis Likert in 1932, used to measure attitudes, opinions, and perceptions. Respondents indicate their level of agreement with a statement by selecting from an ordered set of responses, typically ranging from “strongly disagree” to “strongly agree.” The most common formats are the 5-point Likert scale and the 7-point Likert scale, though some researchers use 4-point, 6-point, or even 10-point versions.
Here is a standard 5-point Likert scale example:
1 = Strongly Disagree
2 = Disagree
3 = Neither Agree Nor Disagree
4 = Agree
5 = Strongly Agree
An important distinction that many people miss is the difference between a Likert-type item and a Likert scale. A single question with a Likert response format is technically called a Likert-type item. A true Likert scale is a composite score created by summing or averaging multiple Likert-type items that all measure the same underlying construct. This distinction matters enormously when deciding between ordinal and interval treatment, and we will return to it later.
Individual Likert-type items produce ordinal data because the response categories have a clear rank order but the psychological distance between “strongly disagree” and “disagree” may not equal the distance between “agree” and “strongly agree.” The numbers 1 through 5 are labels for ordered categories, not measurements of equal-sized intervals.
Ordinal Data vs Interval Data: Key Differences
To understand how to treat Likert data as ordinal versus interval, you need to understand what each level of measurement actually means. This brings us to the four scales of measurement defined by psychologist Stanley Smith Stevens in his seminal 1946 paper: nominal, ordinal, interval, and ratio.
Ordinal data represents categories that have a meaningful rank order, but the distances between adjacent categories are not necessarily equal. You know that “agree” ranks higher than “disagree,” but you cannot say that the gap between them is the same size as the gap between “disagree” and “strongly disagree.” Ordinal data supports rank ordering and comparisons of greater or less than, but it does not support meaningful addition, subtraction, means, or standard deviations.
Interval data represents ordered categories where the distances between adjacent points are equal. The classic example is temperature in Fahrenheit: the difference between 70 and 80 degrees is the same as the difference between 30 and 40 degrees. Interval data supports addition and subtraction, which means you can calculate meaningful means, standard deviations, and use parametric statistics. However, interval data does not have a true zero point, so ratios are not meaningful.
Here is a quick comparison of what mathematical operations each level supports:
Ordinal data allows:
Rank ordering (1st, 2nd, 3rd)
Greater than / less than comparisons
Median and mode as measures of central tendency
Percentiles and quartiles
Interval data allows:
Everything ordinal data allows, plus:
Addition and subtraction
Mean and standard deviation
Parametric tests like t-tests and ANOVA
Confidence intervals around means
The core question for Likert data is whether the intervals between response options are truly equal. If they are, the data can be treated as interval. If they are not, the data should be treated as ordinal and analyzed with non-parametric methods.
The Theoretical Debate: Stevens (1946) and the Scales of Measurement
The debate about how to treat Likert data traces back to Stevens’ 1946 paper “On the Theory of Scales of Measurement,” published in the journal Science. Stevens proposed that different measurement scales permit different statistical operations. Under his framework, ordinal data should only be analyzed with statistics appropriate to ordinal measurement, meaning medians, rank-based correlations, and non-parametric tests.
Stevens introduced what later became known as the “pragmatic sanction,” acknowledging that statistical methods are not inherently tied to measurement scales but that using more powerful statistics on lower-level data carries risks. The purist interpretation says you should never compute a mean of ordinal Likert data because the mean assumes equal intervals. The pragmatist interpretation says that with enough scale points, sufficient sample size, and reasonable distribution, the mean is a useful summary statistic even for Likert responses.
This debate plays out constantly in practice. On Reddit’s r/statistics and r/AskStatistics communities, researchers frequently ask whether they can use parametric tests on Likert data. The responses reveal a consistent pattern: in many applied fields, including psychology, education, marketing, and the health sciences, treating Likert data as interval is standard practice. Reviewers and journals in these fields generally accept it. However, statisticians and methodologists tend to be more cautious and often recommend non-parametric alternatives.
The key insight from Stevens himself is that the appropriate statistical operation depends on what the data represents, not just on the scale format. If the underlying construct is truly continuous and the response categories are rough subdivisions of that continuum, then the data behaves more like interval data. If the construct is truly categorical and the ordering is merely directional, then ordinal treatment is more appropriate.
When to Treat Likert Data as Ordinal
You should treat Likert data as ordinal when the assumptions of interval-level measurement are not defensible. This is the safest and most theoretically conservative approach, and it applies in several specific situations.
Treat Likert data as ordinal when:
You are analyzing a single Likert-type item rather than a composite score. Individual items with 5 or fewer response options almost never meet the assumptions for interval-level analysis. The psychological distances between adjacent categories are unlikely to be equal, and the data is bounded at both ends of the scale.
Your sample size is small. Parametric tests rely on the Central Limit Theorem, which requires a sufficiently large sample for the sampling distribution of the mean to be approximately normal. With small samples (typically fewer than 30 respondents), the normality assumption is harder to justify, and non-parametric tests are more reliable.
Your data distribution is heavily skewed or has extreme ceiling and floor effects. If most respondents selected “strongly agree” or most selected “strongly disagree,” the data may not meet normality assumptions, and non-parametric methods will give you more trustworthy results.
You have fewer than 5 response options. With only 3 or 4 scale points, there is not enough granularity for the data to approximate a continuous distribution. The ordinal nature of the data dominates, and interval-level statistics become unreliable.
Recommended non-parametric tests for ordinal Likert data:
Mann-Whitney U test: comparing two independent groups (alternative to independent t-test)
Wilcoxon signed-rank test: comparing two related groups or paired observations (alternative to paired t-test)
Kruskal-Wallis H test: comparing three or more independent groups (alternative to one-way ANOVA)
Friedman test: comparing three or more related groups (alternative to repeated measures ANOVA)
Spearman’s rank correlation: assessing relationships between two ordinal variables (alternative to Pearson correlation)
Chi-square test: examining associations between categorical variables
For descriptive statistics with ordinal Likert data, report the median and interquartile range rather than the mean and standard deviation. Report frequencies and percentages for each response category. These statistics respect the ordinal nature of the data and are less likely to mislead readers.
When to Treat Likert Data as Interval
You can treat Likert data as interval when specific conditions are met that make the equal-intervals assumption more plausible. Many experienced researchers and entire disciplines routinely treat Likert responses as interval data, and there is substantial empirical evidence supporting this practice under the right circumstances.
Treat Likert data as interval when:
You are working with composite scores. When you sum or average multiple Likert-type items that measure the same construct, the resulting composite score has properties that individual items do not. The composite score has more possible values, tends to approximate a normal distribution more closely, and has better reliability. This is the most common and widely accepted justification for interval-level treatment.
You have a large sample size. With samples of 100 or more respondents per group, the Central Limit Theorem helps ensure that the sampling distribution of the mean is approximately normal, even if the underlying data is ordinal. Many methodologists suggest that samples of 30 or more per group are sufficient for robust parametric analysis, but larger is always better.
You have 7 or more response options on the scale. Research has shown that scales with 7 or more points produce data that more closely approximates continuous measurement. The additional granularity means each step represents a smaller psychological distance, making the equal-intervals assumption more reasonable.
Your reliability is high. If your scale demonstrates strong internal consistency (typically Cronbach’s alpha of 0.70 or above), this indicates that the items are measuring the same underlying construct, which supports treating the composite score as interval-level data.
Your data meets the assumptions of normality, homogeneity of variance, and independence. Run Shapiro-Wilk or Kolmogorov-Smirnov tests to check normality. Use Levene’s test for homogeneity of variance. If these assumptions hold, parametric tests are appropriate and generally more powerful than their non-parametric alternatives.
Recommended parametric tests for interval-treated Likert data:
Independent samples t-test: comparing two independent groups
Paired samples t-test: comparing two related groups or repeated measures
One-way ANOVA: comparing three or more independent groups
Repeated measures ANOVA: comparing three or more related measurements
Pearson correlation: assessing linear relationships between variables
Linear regression: predicting outcomes from one or more predictors
Factor analysis and structural equation modeling: identifying latent constructs
For descriptive statistics with interval-treated Likert data, report the mean and standard deviation. You can also report confidence intervals around the mean. These statistics leverage the additional information available in interval-level data and allow for more nuanced interpretation.
Composite Scores vs Individual Items
This is the distinction that confuses more researchers than any other in this debate, and it is the one that resolves most of the tension. Individual Likert-type items produce ordinal data. Composite Likert scale scores, created by summing or averaging multiple items, can reasonably be treated as interval data.
Here is why this distinction matters. A single 5-point Likert item produces only 5 possible values, each representing an ordered category. But when you sum 10 such items together, the composite score can range from 10 to 50 in increments of 1. This gives you 41 possible values, which begins to approximate a continuous distribution. The Central Limit Theorem works in your favor because the composite score averages out the uneven psychological distances between individual response categories.
Think of it this way: a single Likert item is like a rough snapshot, while a composite score is like a long-exposure photograph that smooths out the noise. The more items you combine, the more the composite score behaves like a continuous, interval-level variable.
The key evidence supporting this comes from Cronbach’s alpha, which measures internal consistency reliability. When Cronbach’s alpha is high (above 0.70), it means the items are strongly interrelated and measuring the same underlying construct. This provides evidence that the composite score is a valid interval-level representation of that construct.
So the practical guidance is simple: if you are analyzing individual items, use non-parametric tests and report medians. If you are analyzing composite scores with good reliability, use parametric tests and report means. This rule resolves the vast majority of real-world situations researchers encounter.
Statistical Tests Comparison: Ordinal vs Interval Approaches
One of the most practical things you need when deciding how to treat Likert data as ordinal versus interval is a clear mapping of which statistical test corresponds to which treatment. The table below pairs each common research scenario with its ordinal (non-parametric) and interval (parametric) alternatives.
Comparing two independent groups: Use the Mann-Whitney U test for ordinal data, or the independent samples t-test for interval data.
Comparing two related/paired groups: Use the Wilcoxon signed-rank test for ordinal data, or the paired samples t-test for interval data.
Comparing three or more independent groups: Use the Kruskal-Wallis H test for ordinal data, or one-way ANOVA for interval data.
Comparing three or more related/repeated groups: Use the Friedman test for ordinal data, or repeated measures ANOVA for interval data.
Assessing correlation between two variables: Use Spearman’s rank correlation for ordinal data, or Pearson correlation for interval data.
Descriptive central tendency: Report the median for ordinal data, or the mean for interval data.
Measures of spread: Report the interquartile range for ordinal data, or the standard deviation for interval data.
Parametric tests are generally more powerful than non-parametric tests when their assumptions are met, meaning they are more likely to detect a true effect. However, when assumptions are violated, non-parametric tests are more trustworthy. Many researchers run both and compare results. If both give you the same conclusion, you can be more confident in your finding regardless of the measurement-level debate.
Decision Framework: How to Choose
Now let me give you a practical, step-by-step framework for deciding how to treat Likert data as ordinal versus interval. This decision checklist incorporates the most important factors from the research literature, forum discussions, and real-world practice.
Step 1: Identify your unit of analysis. Are you analyzing a single Likert-type item or a composite score made from multiple items? Single items should almost always be treated as ordinal. Composite scores with good reliability can be treated as interval.
Step 2: Count your response options. Scales with 3 to 4 points should almost always be treated as ordinal. Scales with 5 points can go either way depending on other factors. Scales with 7 or more points are more defensible as interval, especially for composite scores.
Step 3: Check your sample size. For parametric tests, aim for at least 30 respondents per group as a minimum, though 50 to 100 per group is preferable. With fewer than 30 per group, non-parametric tests are safer.
Step 4: Assess your data distribution. Run normality tests like Shapiro-Wilk. Examine histograms and Q-Q plots. If the data is approximately normal, parametric tests are appropriate. If it is severely skewed or has extreme ceiling or floor effects, use non-parametric tests.
Step 5: Evaluate reliability. Calculate Cronbach’s alpha for your scale. An alpha of 0.70 or higher indicates good internal consistency and supports treating composite scores as interval-level data.
Step 6: Consider your field’s conventions. In psychology, education, marketing, and health sciences, treating Likert composite scores as interval is standard practice. In more methodologically conservative fields, you may need stronger justification. Check what the journals in your field typically accept.
Step 7: Verify parametric assumptions. Even if you decide to treat the data as interval, you still need to check normality, homogeneity of variance (Levene’s test), and independence of observations. If these assumptions fail, fall back on non-parametric alternatives.
Step 8: Report transparently. Whichever approach you choose, state your rationale clearly in your methods section. Acknowledge the ordinal nature of the raw data and explain why your chosen treatment is defensible. Transparency about your reasoning is more important than which choice you make.
Software Implementation: R, SPSS, and Python
One thing that most guides on this topic miss is how to actually implement both approaches in common statistical software. Let me walk you through practical examples.
In R: For ordinal treatment, use the wilcox.test() function for Mann-Whitney or Wilcoxon tests, kruskal.test() for Kruskal-Wallis, and cor(method = “spearman”) for Spearman correlation. For interval treatment, use t.test() for t-tests, aov() for ANOVA, and cor(method = “pearson”) for Pearson correlation. R also offers the psych package for calculating Cronbach’s alpha with the alpha() function, which helps you justify interval-level treatment of composite scores.
In SPSS: For ordinal treatment, navigate to Analyze > Nonparametric Tests. SPSS offers independent-samples, related-samples, and k-related-samples options that guide you to the correct test. For interval treatment, use Analyze > Compare Means for t-tests and ANOVA, and Analyze > Correlate for Pearson correlation. To check normality, use Analyze > Descriptive Statistics > Explore and select normality plots with tests. SPSS will display Kolmogorov-Smirnov and Shapiro-Wilk results.
In Python: For ordinal treatment, use scipy.stats.mannwhitneyu() for the Mann-Whitney U test, scipy.stats.wilcoxon() for Wilcoxon, scipy.stats.kruskal() for Kruskal-Wallis, and scipy.stats.spearmanr() for Spearman correlation. For interval treatment, use scipy.stats.ttest_ind() for independent t-tests, scipy.stats.ttest_rel() for paired t-tests, scipy.stats.f_oneway() for one-way ANOVA, and scipy.stats.pearsonr() for Pearson correlation. For reliability analysis, the pingouin library offers cronbach_alpha() to compute internal consistency.
Here is a quick Python example showing both approaches for a two-group comparison:
Ordinal approach: scipy.stats.mannwhitneyu(group1, group2)
Interval approach: scipy.stats.ttest_ind(group1, group2)
Run both and compare the p-values. If they agree, your conclusion is robust regardless of the measurement-level debate.
Common Mistakes to Avoid
Researchers on forums like Reddit’s r/statistics and r/AskStatistics frequently report falling into the same traps. Here are the most common mistakes and how to avoid them.
Mistake 1: Treating a single Likert item as interval without justification. A single 5-point item is clearly ordinal. Computing a mean and standard deviation for one item is technically inappropriate. Use the median instead, or combine items into a composite score first.
Mistake 2: Ignoring normality assumptions. Even if you decide to treat your Likert data as interval, you still need to check that the data meets parametric assumptions. Skipping normality tests undermines the validity of your parametric analysis. Always run Shapiro-Wilk or Kolmogorov-Smirnov tests before proceeding with parametric statistics.
Mistake 3: Using the wrong descriptive statistics. If you treat data as ordinal, report medians and interquartile ranges. If you treat it as interval, report means and standard deviations. Mixing these up sends mixed signals about your analytical approach and confuses readers.
Mistake 4: Not reporting your rationale. Whichever approach you choose, explain why. Failing to justify your treatment of Likert data invites criticism from reviewers. A single sentence in your methods section explaining your reasoning goes a long way.
Mistake 5: Treating 3-point or 4-point scales as interval. Scales with very few response options simply do not have enough granularity to approximate interval measurement. Even pragmatists agree that 3-point scales should be analyzed with non-parametric methods.
Mistake 6: Confusing Likert items with Likert scales. Remember that a Likert item is a single question, while a Likert scale is a composite of multiple items. The measurement properties are different, and the appropriate statistical treatment differs accordingly.
FAQs
Are Likert scales ordinal or interval scales?
Likert data is technically ordinal because individual response categories represent ranked categories without guaranteed equal distances between them. However, when multiple Likert-type items are summed or averaged into a composite score, the resulting data is often treated as interval data, especially in psychology, education, and social science research.
Can you take the mean of Likert scale data?
Taking the mean of a single Likert item is technically inappropriate because individual items produce ordinal data. However, computing the mean of a composite Likert score (the sum or average of multiple related items) is widely accepted in practice, provided the scale demonstrates adequate reliability and the sample size is sufficient. Many researchers report both the mean and median for transparency.
Under what conditions should Likert scales be used as ordinal or interval data?
Treat Likert data as ordinal when analyzing individual items, working with small samples (fewer than 30 per group), using scales with fewer than 5 points, or when data is heavily skewed. Treat Likert data as interval when analyzing composite scores with high reliability (Cronbach alpha above 0.70), working with large samples (100 or more), using 7-point or larger scales, and when normality assumptions are met.
Can Likert scales be treated as interval scales?
Yes, Likert scales can be treated as interval scales under specific conditions. Composite scores from multiple items, large sample sizes, scales with 7 or more points, high internal consistency reliability, and data that meets normality assumptions all support interval-level treatment. This practice is standard in many social science and psychology research contexts.
Is a Likert scale continuous or ordinal?
A single Likert item produces ordinal data, not continuous data. However, composite Likert scale scores created by summing or averaging multiple items approximate a continuous distribution and are often treated as interval-level continuous data in statistical analysis. The more items combined, the more the composite score behaves like a continuous variable.
What statistical tests should I use for Likert data?
For ordinal treatment, use non-parametric tests like the Mann-Whitney U test, Wilcoxon signed-rank test, Kruskal-Wallis H test, Friedman test, and Spearman rank correlation. For interval treatment, use parametric tests like the independent t-test, paired t-test, ANOVA, repeated measures ANOVA, and Pearson correlation. Choose based on whether you are analyzing individual items or composite scores, sample size, number of scale points, and whether parametric assumptions are met.
Conclusion
Deciding how to treat Likert data as ordinal versus interval does not have to be a paralyzing debate. The key is understanding the distinction between individual Likert-type items, which are clearly ordinal, and composite Likert scale scores, which can reasonably be treated as interval when specific conditions are met.
The most important takeaways are these: use non-parametric tests and medians for individual items with small samples or few scale points. Use parametric tests and means for composite scores with high reliability, adequate sample sizes, and scales with 5 or more points. Always check your assumptions, report your reasoning, and when in doubt, run both ordinal and interval analyses to see if your conclusions converge.
By following the decision framework in this guide, you can make a defensible, well-reasoned choice for any survey research project. The question of how to treat Likert data as ordinal versus interval ultimately comes down to context, evidence, and transparency. Choose the approach that best fits your data, justify it clearly, and your research will stand up to scrutiny.