
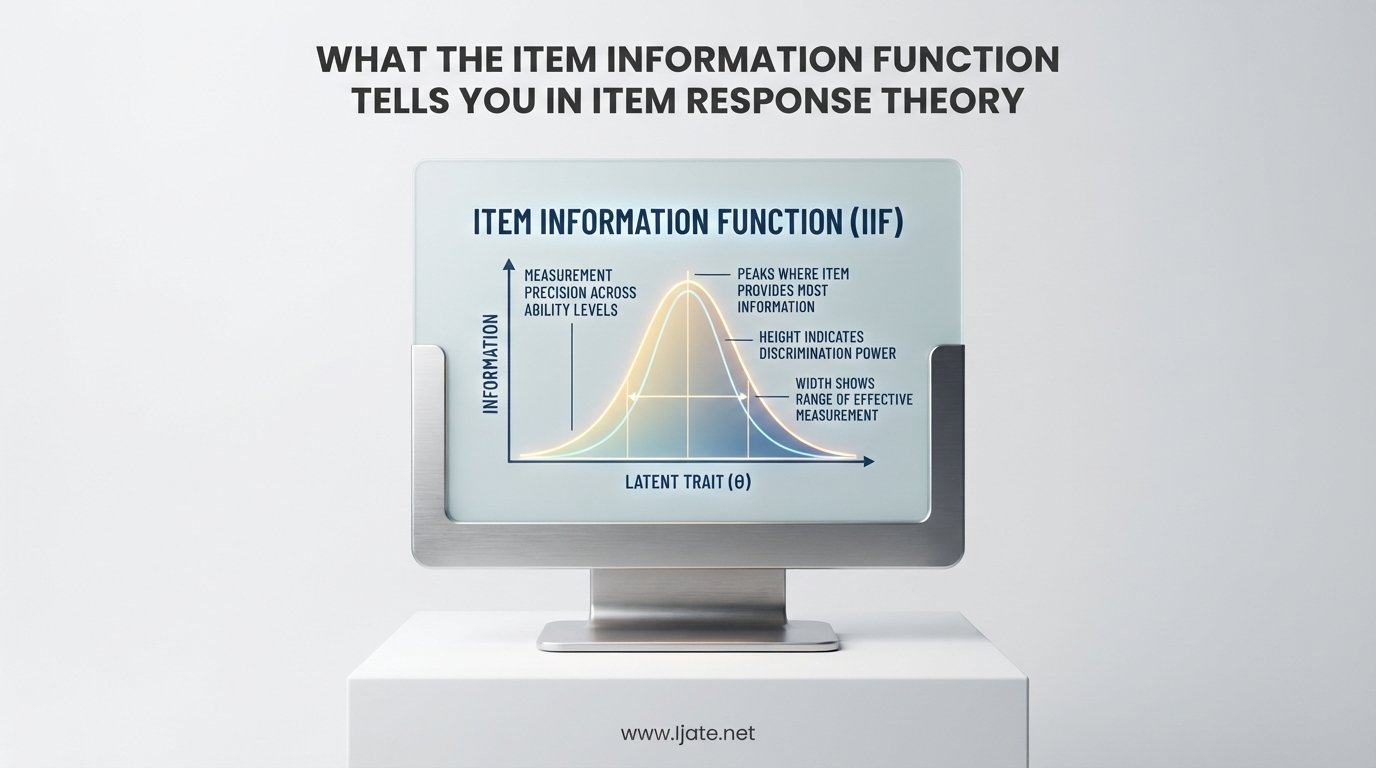
The item information function (IIF) tells you how precisely a single test question measures a person’s ability at each level of the latent trait, calculated by multiplying the probability of a correct response by the probability of an incorrect response and weighting that product by the item’s discrimination power. In Item Response Theory (IRT), this function is the backbone of measurement precision analysis. It answers a deceptively simple question: at which ability levels does this particular item give us the most useful information about the person taking the test?
If you work in psychometrics, test development, or educational assessment, understanding the item information function changes how you think about every question on your test. Instead of asking whether an item is simply “good” or “bad,” you start asking where on the ability scale it does useful work. A question that is excellent for distinguishing average-ability students might be useless for identifying top performers, and the IIF shows you exactly why.
In this guide, I will walk you through what the item information function tells you in Item Response Theory, how it is calculated, how it behaves across different IRT models, and how to use it practically when designing or evaluating assessments. Whether you are a graduate student encountering IRT for the first time or a seasoned test developer refining your item bank, this breakdown will give you a clear, practical understanding of one of IRT’s most important concepts.
Table of Contents
What Is the Item Information Function in IRT?
The item information function is a mathematical function that quantifies how much psychometric information a single test item provides at each point along the ability continuum (typically denoted as theta). It tells you the measurement precision of one specific item for examinees at every ability level. Higher information values mean the item is more useful for distinguishing between people near that ability level.
Think of it this way: a test item is like a measuring tape. A tape marked only in inches is fine for rough estimates but useless for measuring something to the millimeter. Similarly, an item provides fine-grained measurement at certain ability levels and coarse, nearly useless measurement at others. The IIF maps this precision across the entire ability range.
This is a fundamental shift from Classical Test Theory (CTT), where reliability is treated as a single number that applies to the entire test regardless of who is taking it. In IRT, precision is conditional. The same item can be highly informative for a student at theta = 0 and nearly useless for a student at theta = 2. The item information function makes this conditional precision visible and quantifiable.
How the Item Information Function Is Calculated
The item information function is derived from the item response function (also called the item characteristic curve). At its core, it is calculated by multiplying the probability of a correct response by the probability of an incorrect response, then weighting that product by the squared slope of the item response function at that point.
For the 2-parameter logistic (2PL) model, the formula is:
I(theta) = a squared times P(theta) times Q(theta)
Where a is the discrimination parameter, P(theta) is the probability of a correct response at ability level theta, and Q(theta) is the probability of an incorrect response (1 minus P). This means information is highest when P and Q are both moderate (around 0.5 each) and when the discrimination parameter is large.
The logic is intuitive once you break it down. When P(theta) is close to 1, almost everyone gets the item right, so it provides little information for distinguishing among people. When P(theta) is close to 0, almost everyone gets it wrong, which is equally uninformative. Maximum discrimination between individuals happens when about half the people answer correctly and half answer incorrectly. At that point, the item is doing its best work.
The squared discrimination parameter (a squared) acts as a multiplier on this product. An item with a high a-parameter concentrates its information into a narrow range around its difficulty level. An item with a low a-parameter spreads modest information across a wider range but never reaches high peak values.
For the 3PL model, the calculation adjusts for the guessing parameter (c). The formula becomes slightly more complex because the lower asymptote is no longer zero. This adjustment typically reduces information at low ability levels, since the item response function is flatter in that region when guessing is involved.
What Each Parameter Tells You About Item Information
The Discrimination Parameter (a)
The discrimination parameter is the single biggest driver of item information. It represents how steeply the probability of a correct response rises as ability increases. A steep rise means the item sharply differentiates between people just below and just above a certain ability threshold. That sharp transition is exactly what produces high information values.
Items with high a-parameters (above 1.5 in many reporting systems) have tall, narrow information peaks. They provide a lot of precision but only within a tight ability band. Items with low a-parameters (below 0.5) have short, wide information curves that provide small amounts of information across a broader range. Neither is inherently better. The choice depends on what ability range your test needs to cover.
However, extremely high a-parameters can be a warning sign. In real-world data analysis, items with a-values above 3 or 4 sometimes indicate estimation problems, especially with small sample sizes. The item might be capitalizing on chance patterns in the data rather than truly discriminating that sharply. Always check standard errors on your parameter estimates before celebrating a high discrimination value.
The Difficulty Parameter (b)
The difficulty parameter tells you where the item information peaks. Specifically, for the 1PL and 2PL models, the item provides maximum information at the ability level equal to the b-parameter. If an item has a difficulty of b = 1.0, it is most informative for examinees whose ability is one standard deviation above the mean.
This is one of the most practically useful facts about the IIF. It means you can look at your item bank’s difficulty distribution and immediately know whether your test covers the ability range you care about. If you are building a certification test with a cut score at theta = 1.5, you want items whose b-parameters cluster around 1.5, because that is where they provide maximum measurement precision at the decision point.
Difficulty and discrimination interact in the IIF. A difficult item with a high discrimination parameter provides very concentrated, high-precision measurement at high ability levels but almost nothing at low ability levels. An easy item with the same discrimination provides the same concentrated precision at low ability levels. Together, a and b determine both the height and the location of the information peak.
The Guessing Parameter (c)
The guessing parameter, used only in the 3PL model, represents the probability that a low-ability examinee will answer correctly by chance. This parameter suppresses item information at low ability levels. Because the lower asymptote of the item response function is no longer zero, the curve is flatter in that region, and the slope (which drives information) is reduced.
In practice, this means multiple-choice items with obvious distractors that invite guessing will provide less information for low-ability examinees than you might expect based on difficulty alone. The guessing parameter quantifies this loss of precision and shifts the information peak slightly toward higher ability levels.
How Item Information Varies Across Ability Levels
This is where the item information function becomes truly powerful as an analytical tool. Unlike a single reliability coefficient, the IIF paints a complete picture of where an item works and where it falls flat. When you plot IIF values across the theta continuum, you get a curve that reveals the item’s measurement profile.
For a typical 2PL item, the IIF curve looks like an inverted bell. It rises to a peak at the ability level equal to the item’s difficulty parameter and tapers off on both sides. The height of the peak is determined by the discrimination parameter, and the width of the curve is inversely related to discrimination. High discrimination means a tall, narrow peak. Low discrimination means a short, wide curve.
What does this mean for test interpretation? Consider a math item calibrated with a difficulty of theta = 0 and a discrimination of a = 1.2. This item provides excellent measurement for students near the average ability level. It contributes almost nothing to the precision of measurement for students three standard deviations above or below the mean. If your test needs to identify gifted students at the high end, this item would not help you. If it needs to classify students into pass and fail categories near the middle of the distribution, this item would be valuable.
When you examine IIF curves for all items in a test, patterns emerge. You might discover that most of your items cluster information around average ability, leaving a measurement gap at the extremes. Or you might find that one item dominates the test’s precision in a narrow range while others contribute almost nothing. These insights are invisible in CTT but immediately apparent when you examine item information curves.
Item Information Function vs Test Information Function
The item information function tells you about a single item. The test information function (TIF) tells you about the entire test. The relationship is straightforward: the test information function is the sum of all individual item information functions at each ability level.
TIF(theta) = I1(theta) + I2(theta) + … + In(theta)
This additive property is one of the most useful features of IRT. It means you can build a test to target specific ability ranges by selecting items whose IIF peaks fall in those ranges. Want more precision at the pass-fail boundary? Add items with difficulty parameters near that cut score. Want a broadly informative test across all ability levels? Select items with difficulty parameters spread across the theta continuum.
The test information function also connects directly to the conditional standard error of measurement (CSEM). The CSEM at any ability level is calculated as 1 divided by the square root of the test information at that level. High test information means low standard error, which means tight confidence intervals around ability estimates. Low test information means large standard error and less confidence in score estimates.
This relationship is a major advantage over CTT, which provides a single standard error of measurement for the entire test. In IRT, the standard error varies by ability level, giving you a more honest and useful picture of where your test measures well and where it measures poorly.
How IIF Differs Across 1PL, 2PL, and 3PL Models
The IRT model you choose directly shapes what the item information function looks like for each item. The differences are not just mathematical formalities. They affect practical decisions about item quality and test design.
1PL (Rasch Model)
In the 1-parameter logistic model, all items share the same discrimination parameter. This means every item in the test has an information function with the same shape and height. Only the location of the peak changes, determined by each item’s difficulty parameter. This uniformity is intentional and is one of the Rasch model’s defining properties. It simplifies interpretation but limits flexibility, since items that discriminate differently in reality are forced into a single discrimination value.
2PL Model
The 2PL model allows each item to have its own discrimination parameter. This produces IIF curves of varying heights and widths across items. Some items will have tall, narrow information peaks that provide intense precision at specific ability levels. Others will have lower, broader curves. This model gives test developers more realistic item profiles and greater flexibility in test assembly.
3PL Model
The 3PL model adds a guessing parameter. As discussed earlier, guessing reduces information at low ability levels by flattening the lower tail of the item response function. Items in the 3PL model typically show slightly asymmetric information curves compared to the 2PL, with the peak shifted and the left tail suppressed. The practical effect is that 3PL information curves are usually shorter than their 2PL counterparts for the same items, reflecting the precision cost of guessing.
Choosing among these models involves trade-offs. The 1PL offers simplicity and specific desirable measurement properties. The 2PL provides realistic item-level precision profiles. The 3PL accounts for guessing but requires larger sample sizes for stable parameter estimation. The item information function looks different in each, so the model choice has direct consequences for how you interpret item quality.
Practical Uses of the Item Information Function
Understanding the IIF is not just an academic exercise. It has direct, practical applications that test developers and psychometricians use every day.
Item Selection and Test Assembly
When building a test from an item bank, you can use IIF values to select items that maximize measurement precision at your target ability range. If your certification exam has a cut score at theta = 1.0, you prioritize items whose information peaks near that value. This targeted approach produces shorter tests with equivalent or better precision than longer tests built without IIF guidance.
Automated test assembly algorithms use IIF values as inputs to optimize test forms. The goal is typically to maximize test information at specific ability levels while satisfying content constraints (topic coverage, format balance, time limits). The IIF provides the quantitative foundation that makes this optimization possible.
Computerized Adaptive Testing (CAT)
In computerized adaptive testing, the item information function is central to item selection. After each response, the CAT system estimates the examinee’s current ability and selects the next item that provides maximum information at that estimated ability level. This is why CAT can achieve precise ability estimates with fewer items than fixed-form tests: every item is chosen to be maximally informative for that specific person.
The efficiency gains from CAT depend entirely on having items with strong IIF values across the ability range. Gaps in the item bank, where no items provide high information at certain theta levels, directly translate to less precise ability estimates for examinees in those ranges. Maintaining a well-calibrated item bank with broad IIF coverage is essential for effective CAT implementation.
Evaluating and Refining Existing Tests
When reviewing an existing test, examining IIF curves for all items helps identify weak spots. Items with flat, low information curves across the entire ability range are candidates for revision or removal. Items with information concentrated in irrelevant ability ranges might need to be replaced with better-targeted alternatives. This diagnostic process is far more informative than simply checking item-total correlations or point-biserial statistics from CTT.
Differential Item Functioning (DIF) Analysis
Item information functions can also reveal differential item functioning, where an item performs differently for different demographic groups. Comparing IIF curves across groups can show whether an item provides equivalent measurement precision for all examinees or whether it systematically disadvantages certain groups. This application supports fair and equitable assessment practices.
Common Misconceptions About Item Information Values
Misconception 1: Item Information Is Bounded Between 0 and 1
This is the most common misunderstanding about IIF values. Item information is not bounded between 0 and 1 like a probability or a reliability coefficient. In the 2PL and 3PL models, information values can exceed 1.0, sometimes substantially, depending on the discrimination parameter. An item with a discrimination parameter of 2.0 can produce information values above 2.0 at its peak. The theoretical upper bound depends on the model and parameter values.
I have seen this misconception cause real confusion in practice. Researchers analyzing their data for the first time often panic when they see IIF values above 1, assuming something is wrong. Nothing is wrong. The IIF scale reflects the Fisher information concept, which is not constrained to the 0-1 interval. A value of 2.0 simply means the item provides substantial measurement precision at that ability level.
Misconception 2: Extremely High Item Information Means Overfitting
Extremely high item information values are not automatically evidence of overfitting, but they do warrant investigation. A very high a-parameter (above 4 or 5) can indicate genuinely excellent discrimination, but it can also signal estimation instability, especially with small sample sizes. The key diagnostic step is to check the standard error of the a-parameter estimate. If the standard error is also large, the high information value may not be trustworthy.
Forum discussions reveal that practitioners with small samples (n under 200) frequently encounter this issue. In one documented case, a researcher analyzing 30 items with only 66 respondents found a-parameters of 4.93 and 8.41. These values were likely artifacts of the small sample rather than real measurement properties. As a rule of thumb, stable IRT parameter estimation typically requires at least 200 to 500 respondents, with larger samples needed for 3PL models.
Misconception 3: Low Information Items Are Always Bad
Low information values across all ability levels do suggest a weak item. But an item with low information in one range and adequate information in another may still serve a purpose in the overall test design. The question is whether the item contributes to the test information function at ability levels where the test needs more precision. Evaluating items in the context of the full test, not in isolation, leads to better decisions.
FAQs
What is the item response theory in simple terms?
Item Response Theory is a framework for designing and scoring tests that models the relationship between a person’s underlying ability (called a latent trait or theta) and their probability of answering each item correctly. Instead of just counting correct answers, IRT estimates where each person falls on an ability scale and how well each item measures that ability.
What is the IRT item information function?
The item information function shows how much measurement precision a single test item provides at each level of the ability being measured. It is calculated by multiplying the probability of a correct response by the probability of an incorrect response and weighting that product by the item’s discrimination parameter squared. Higher values mean the item is more useful for distinguishing between examinees at that ability level.
What is information in IRT?
In IRT, information refers to the Fisher information that an item or test provides about a person’s ability at a specific point on the theta scale. More information means less uncertainty in the ability estimate. Item information is specific to one question, while test information is the sum of all item information values at each ability level. Information is inversely related to the standard error of measurement.
What is the difference between classical test theory CTT and item response theory IRT?
CTT treats test reliability and standard error as single values that apply to all examinees, while IRT makes these properties conditional on ability level. CTT scores depend on the specific items on the test, while IRT item and person parameters are sample-independent (invariant) when the model fits. IRT also provides item-level precision analysis through the item information function, which CTT cannot offer.
What is the 3 parameter IRT model?
The 3-parameter logistic (3PL) model is an IRT model that estimates three parameters for each item: difficulty (b), discrimination (a), and guessing (c). The guessing parameter accounts for the probability that low-ability examinees answer correctly by chance. The 3PL model is commonly used for multiple-choice items where guessing is possible, but it requires larger sample sizes for stable parameter estimation than the 1PL or 2PL models.
Can item information values exceed 1.0 in IRT?
Yes, item information values can exceed 1.0. Item information is based on Fisher information, not probability, so it is not bounded between 0 and 1. In the 2PL and 3PL models, items with high discrimination parameters can produce information values of 2.0 or higher at their peak. Seeing values above 1 is normal and does not indicate an error.
How is the test information function related to item information functions?
The test information function is the sum of all individual item information functions at each ability level. By adding up the IIF values from every item on the test, you get the total measurement precision of the test at each point on the theta scale. The conditional standard error of measurement is then calculated as 1 divided by the square root of the test information at that ability level.
Conclusion
The item information function tells you exactly where and how well a single test item measures ability in Item Response Theory. It reveals the precision of measurement at every point on the ability scale, shows you which items contribute most to distinguishing between examinees, and gives you the quantitative foundation needed for evidence-based test design decisions.
The most important takeaways are these. First, the IIF peaks at the item’s difficulty level, so item selection should target the ability range where you need the most measurement precision. Second, the discrimination parameter determines how tall and narrow that peak is, with higher values providing concentrated precision. Third, item information is not bounded between 0 and 1, and values above 1 are normal for well-discriminating items. Fourth, the test information function is simply the sum of all item information functions, and it directly determines the conditional standard error of measurement.
If you are building or evaluating assessments, I encourage you to move beyond looking at single reliability numbers and start examining item information curves for your items. Plot the IIF for each item in your bank. Identify where your test has strong information and where it has gaps. Use those insights to select items strategically, especially around cut scores and decision points. This shift from global to conditional thinking about measurement precision is what separates competent test users from skilled psychometric practitioners.
The item information function is one of IRT’s most practical tools. Once you understand what it tells you, you will never look at a test the same way again.